Data Governance & Data Privacy
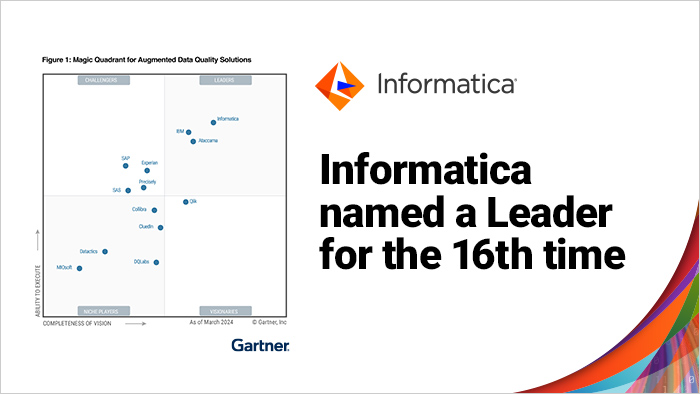
Informatica Named a Leader in the Gartner® Magic Quadrant™ for Augmented Data Quality Solutions
Mar 11, 2024
Data Governance & Data Privacy
Informatica Named a Leader in the Gartner® Magic Quadrant™ for Augmented Data Quality Solutions
Mar 11, 2024
Recommended for you


Trending Now

Life@INFA
Culture of Inclusion: Informatica's International Women's Day Story
Mar 08, 2024
Life@INFA
Culture of Inclusion: Informatica's International Women's Day Story
Mar 08, 2024

Cloud Data Management
Addressing the Challenges of BCBS 239 Compliance With a Modern Approach to Data Management
Feb 23, 2024
Cloud Data Management
Addressing the Challenges of BCBS 239 Compliance With a Modern Approach to Data Management
Feb 23, 2024


