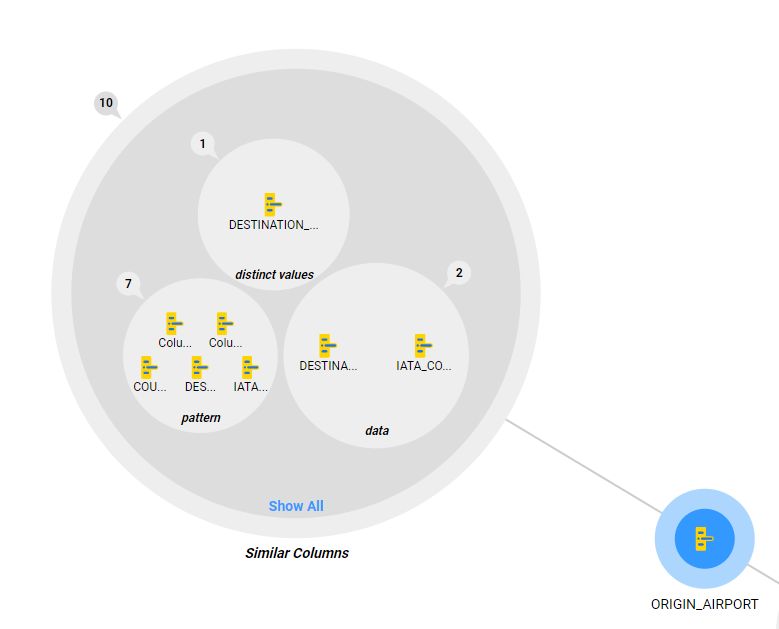
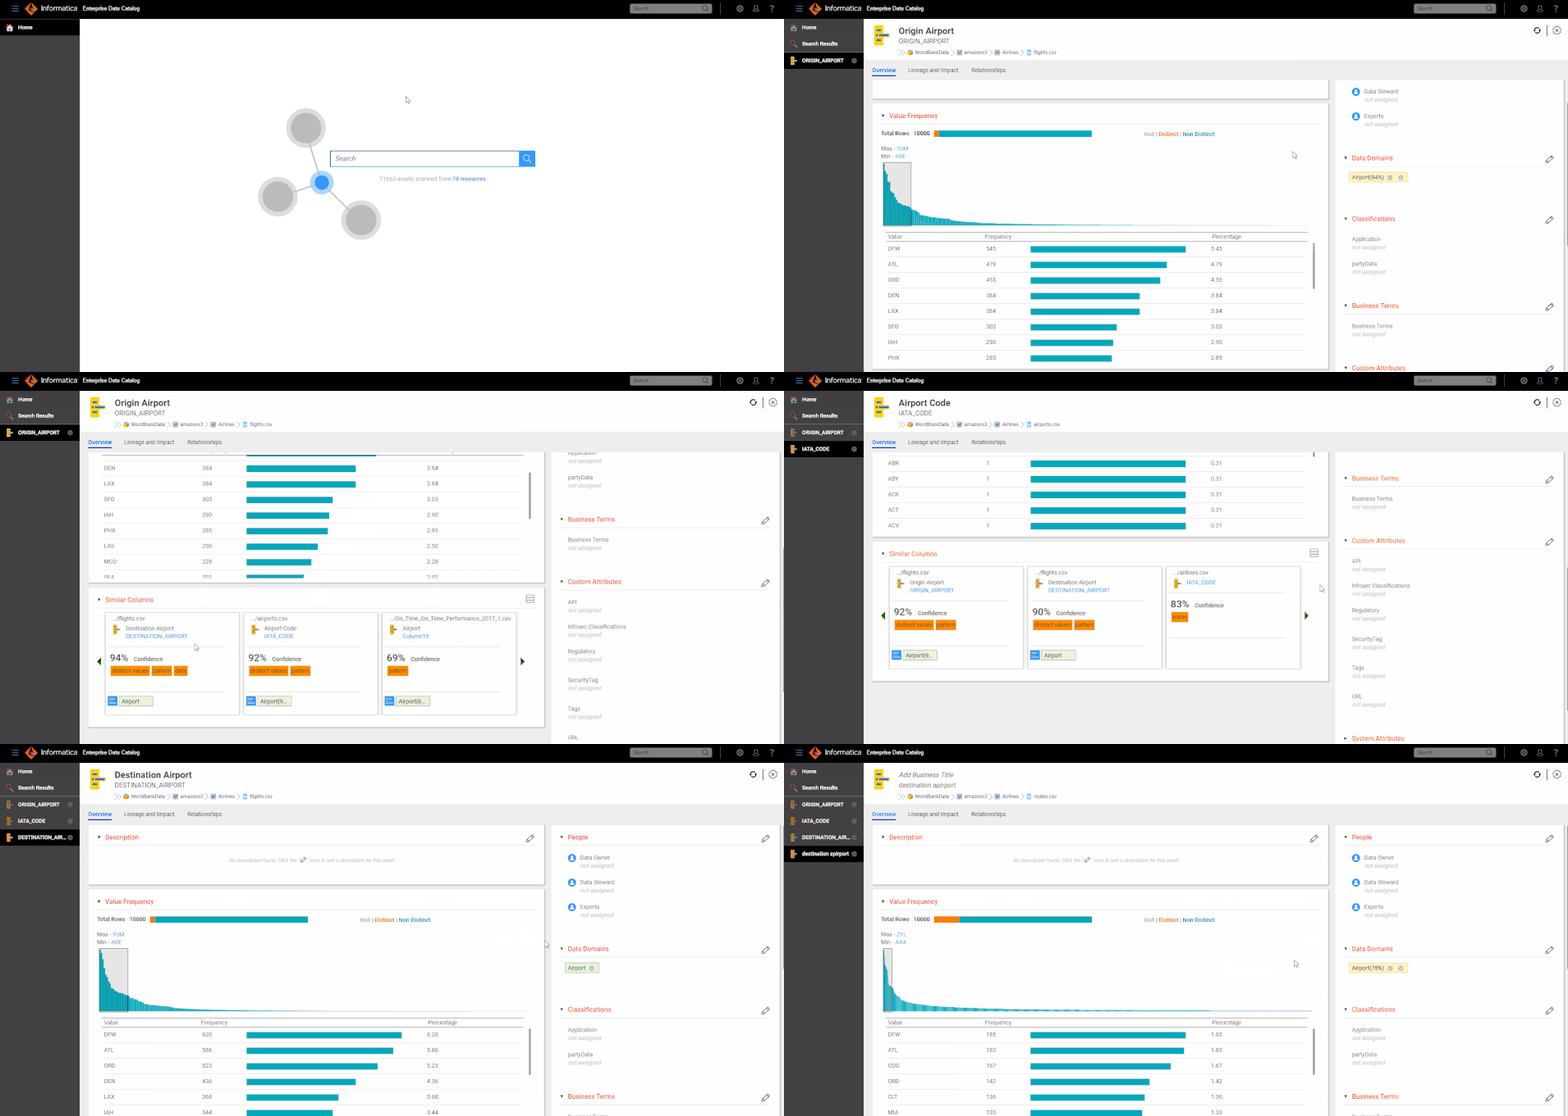
Ability to accurately label columns, attributes and fields is a critical requirement for both data discovery and data governance. However, organizations can have millions of datasets and hundreds of millions of columns/fields in various structured and semi-structured data sources, making it impossible to manually curate them one by one. Also, not all columns represent unique business concepts/data elements. A single data element, like a CUSTOMER ID or PRODUCT ID, can be a part of multiple datasets. Machine learning can help cluster these "instances" of data elements together based on data similarity. This makes it easier for data stewards and curators to manage these columns as well as data analysts to find the right data assets.

"Similar" is an overloaded term and similarity between two objects is largely based on context and use case. For a data curator labeling columns/fields with business terms, two columns are similar if they represent the same business concept like CUSTOMER ID or AIRLINE NAME or CITY. For a data scientist, searching for Sales numbers from Q42017, the sales dataset for Q12018 is similar.
 Enterprise Data Catalog
(EDC) uses unsupervised clustering based on multiple factors to cluster similar columns. These factors are:
- Data Overlap: For any two columns, this metric determines the percentage of overlapping values in both the columns.
- Distinct Value Match: This metric measures the overlap of distinct/unique values between two columns
- Pattern Match: This metric uses data profiling to first identify the dominant data patterns for each column and field. Then it checks for the overlap of these patterns across column pairs.
- Name Match: This uses fuzzy string matching to identify columns and fields that are named similarly.
This clustering is done across multiple data sources and datasets. It also assigns, both an overall similarity score as well as the match likelihood for each factor to help with different use cases.
It is important to mention that the above computation cannot be done pairwise across all columns and fields. As an example, with 100M columns - not very uncommon in large enterprises today - there are roughly 5000 Trillion column-pairs. If evaluating similarity for each column pair took a millisecond, the calculation would take 5 trillion seconds or roughly 90000 years. Suffice to say we need a different approach. This is where EDC uses unsupervised machine learning provided through the
CLAIRE™ engine to exponentially reduce the time taken to derive similarity from years to hours.

Once these similar columns are clustered, they can be used for a wide variety of use cases:
- Related Assets: Analysts are typically interested in finding data related to a topic. Their productivity can be greatly enhanced by recommending assets with substitutable (similar) or complementary (unionable or joinable) data. "Data Overlap" analysis at the dataset level can provide information about substitutable datasets. "Unique Value match" at the column level can provide information about other joinable datasets.
- Data Curation: Curators adding business terms and labels to columns and fields can use similarity to identify cluster of similar columns and associate the label to the cluster instead of individual instances. This substantially reduces the amount of manual work needed to label all key data elements accurately in the enterprise.
- Identify Duplicates: Identifying duplicate and redundant data can significantly help reduce data storage costs in an organization. Data Overlap analysis helps identify duplicate datasets across data sources.
Column Similarity is one of the key new features being introduced in Enterprise Data Catalog Spring 2018 release.

 Enterprise Data Catalog(EDC) uses unsupervised clustering based on multiple factors to cluster similar columns. These factors are:


