
Informatica Reports Second Quarter 2022 Financial Results
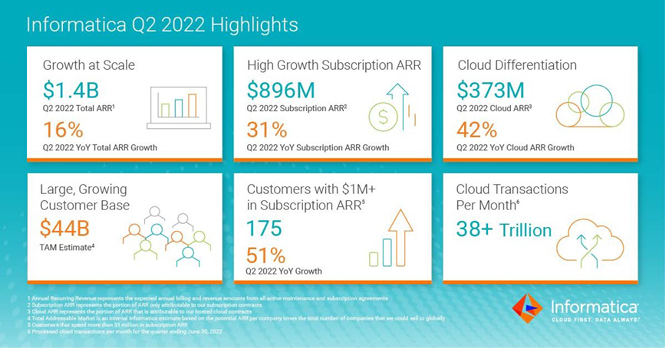
- Subscription annual recurring revenue (ARR) in the second quarter increased 31% year-over-year to $896 million
- Cloud ARR in the second quarter increased 42% year-over-year to $373 million
- Subscription revenue in the second quarter increased 24% year-over-year to $207 million
REDWOOD CITY, CA, July 27, 2022 — Informatica (NYSE: INFA), an enterprise cloud data management leader, today announced financial results for its second quarter 2022, ended June 30, 2022.
“We are very pleased to deliver Q2 results that exceeded the high-end of guidance for total revenue, subscription and cloud ARR, and non-GAAP operating income. The mix shift from self-managed to the cloud is accelerating and customers are increasingly investing in our Intelligent Data Management Cloud (IDMC) platform for digital transformation. We are strongly positioned to deliver $1 billion in subscription ARR by the end of the year, a milestone few software companies have achieved,” said Amit Walia, Chief Executive Officer at Informatica. “We continue to see healthy demand for IDMC as companies look to Informatica to help them navigate the uncertain macro-environment and process mission-critical workloads.”
Second Quarter 2022 Financial Highlights:
- GAAP Total Revenues increased 9% year-over-year to $372.0 million.
- GAAP Subscription Revenues increased 24% year-over-year to $207.0 million.
- Total ARR increased 16% year-over-year to $1.4 billion.
- GAAP Operating Loss of $12.1 million and Non-GAAP Operating Income of $69.9 million.
- GAAP Operating Cash Flow of $15.9 million.
- Unlevered Free Cash Flow (after-tax) of $32.7 million.
A reconciliation of GAAP to non-GAAP financial measures has been provided in the tables included in this press release. An explanation of these measures is also included below under the heading “Non-GAAP Financial Measures.”
Second Quarter 2022 Business Highlights:
- Processed 38.5 trillion cloud transactions per month for the quarter ended June 30, 2022, as compared to 21.7 trillion cloud transactions per month in the same quarter last year, an increase of 77% year-over-year.
- Reported 175 customers that spend more than $1 million in subscription ARR at the end of June 30, 2022, an increase of 51% year-over-year.
- Reported 1,791 customers that spend more than $100,000 in subscription ARR at the end of June 30, 2022, an increase of 20% year-over-year.
- Achieved a subscription net retention rate of 113% at the end of June 30, 2022.
Product Innovation:
- Launched a new strategic partnership with Oracle that brings Informatica’s data integration and data governance solutions to Oracle Cloud Infrastructure (OCI). Named a preferred partner for enterprise cloud data integration and governance for data warehouse and lakehouses on OCI.
- Launched Intelligent Data Management Cloud (IDMC) for Healthcare & Life Sciences and Financial Services verticals - an end-to-end integrated data management cloud that enables the entire data lifecycle, including data discovery, ingestion, integration of data and applications, quality improvement, single views and business 360 applications, governance, privacy, and data sharing.
- Launched Informatica Data Loader - a no-cost, zero-code, zero-DevOps, and zero infrastructure required SaaS offering that will help departmental users across the organization move from data to insights in minutes. Data loader is now available for Google BigQuery, Snowflake, and Databricks.
- Launched a SaaS version of Informatica’s multidomain Master Data Management (MDM) for Microsoft Azure that will be generally available for purchase on the Azure Marketplace in August.
- Launched a new API Center that delivers no-code data APIs to build a foundation of trusted data and automate business processes.
- Launched INFACore to bring IDMC platform capabilities to developers, data scientists, and data engineers directly in their own integrated development environment. INFACore is a simple plug-in for any development and data science framework accelerating the ability to consume, transform, and prepare data from any source within an Integrated Development Environment (IDE).
- Expanded partnership with Snowflake that will result in deeper, product integrations for data governance. Announced a new Informatica Enterprise Data Integrator built for Snowflake’s Native Application Framework that will enable Snowflake customers to integrate with enterprise data sources including Google, Microsoft, Oracle, Salesforce, and SAP.
- Joined the Data Cloud Alliance, spearheaded by Google Cloud, which is focused on making data and analytics more accessible via modern data management technologies.
Industry Recognition:
- Named a 2022 Gartner® Peer Insights™ Customers' Choice for Master Data Management. Informatica is also the only enterprise multidomain MDM platform vendor with the most reviews during the assessment period.
- Recognized as a Leader in Nucleus Research iPaaS Technology Value Matrix 2022, making this Informatica’s third consecutive year in a row to be named a Leader.
- Named a Leader in The Forrester Wave™: Enterprise Data Fabric, Q2 2022.
- Named a Leader in The Forrester Wave™: Enterprise Data Catalogs for DataOps, Q2 2022.
- Named in the 2021 Gartner® Event Stream Processing Platforms Market Share Report. Informatica ranked #2 in the market.
Third Quarter and Full-Year 2022 Financial Outlook
The Company provides the financial guidance below based on current market conditions and expectations and subject to various important cautionary factors described below. Guidance includes the full-year 2022 revenue impact from foreign exchange headwinds estimated at approximately negative $45 million. Based on information available as of July 27, 2022, guidance for the third quarter of 2022 and full-year 2022 is as follows:
Third Quarter 2022 Ending September 30, 2022:
- GAAP Total Revenues are expected to be in the range of $385 million to $395 million, representing approximately 8% year-over-year growth at the midpoint of the range.
- Subscription ARR is expected to be in the range of $920 million to $930 million, representing approximately 26% year-over-year growth at the midpoint of the range.
- Cloud ARR is expected to be in the range of $399 million to $405 million, representing approximately 40% year-over-year growth at the midpoint of the range.
- Non-GAAP Operating Income is expected to be in the range of $77 million to $84 million.
Full-Year 2022 Ending December 31, 2022:
- GAAP Total Revenues are now expected to be in the range of $1,540 million to $1,560 million, representing approximately 7% year-over-year growth at the midpoint of the range.
- Total ARR is expected to be in the range of $1,520 million to $1,550 million, representing approximately 13% year-over-year growth at the midpoint of the range.
- Subscription ARR is expected to be in the range of $990 million to $1,010 million, representing approximately 25% year-over-year growth at the midpoint of the range.
- Cloud ARR is expected to be in the range of $438 million to $448 million, representing approximately 40% year-over-year growth at the midpoint of the range.
- Non-GAAP Operating Income is expected to be in the range of $325 million to $345 million.
- Unlevered Free Cash Flow (after-tax) is now expected to be in the range of $290 million to $310 million.
In addition to the above guidance, the Company is also providing a third quarter and full-year 2022 weighted-average number of basic and diluted share estimates for modeling purposes. For the third quarter 2022, we expect basic weighted-average shares outstanding to be approximately 282 million shares and diluted weighted-average shares outstanding to be approximately 285 million shares. For the full-year 2022, we expect basic weighted-average shares outstanding to be approximately 281 million shares and diluted weighted-average shares outstanding to be approximately 287 million shares.
Reconciliation of non-GAAP operating income and unlevered free cash flow after-tax guidance to the most directly comparable GAAP measures is not available without unreasonable effort, as certain items cannot be reasonably predicted because of their high variability, complexity, and low visibility. In particular, the measures and effects of our stock-based compensation expense specific to our equity compensation awards and employer payroll tax-related items on employee stock transactions are directly impacted by the timing of employee stock transactions and unpredictable fluctuations in our stock price, which we expect to have a significant impact on our future GAAP financial results.
Webcast and Conference Call
A conference call to discuss Informatica’s second quarter 2022 financial results and financial outlook for the third quarter and full-year 2022 is scheduled for 1:30 p.m. Pacific Time today. To participate, please dial 1-844-200-6205 from the U.S. or 1-929-526-1599 from international locations. The conference passcode is 902394. A live webcast of the conference call will be available on the Investor Relations section of Informatica’s website at investors.informatica.com where presentation materials will also be posted prior to the conference call. A replay will be available online approximately two hours following the live call for a period of 30 days.
Forward-Looking Statements
This press release and the related conference call and webcast contain forward-looking statements within the meaning of Section 27A of the Securities Act of 1933, as amended, and Section 21E of the Securities Exchange Act of 1934, as amended. These statements may relate to, but are not limited to, expectations of future operating results or financial performance, including expectations regarding achieving profitability and our GAAP and non-GAAP guidance for the third quarter and 2022 fiscal year, management’s plans, priorities, initiatives, and strategies, and management's estimates and expectations regarding growth of our business, market, and partnerships. Forward-looking statements are inherently subject to risks and uncertainties, some of which cannot be predicted or quantified. In some cases, you can identify forward-looking statements because they contain words such as “anticipate,” “believe,” “contemplate,” “continue,” “could,” “estimate,” “expect,” “intend,” “may,” “plan,” “potential,” “predict,” “project,” “should,” “target,” “toward,” “will,” or “would,” or the negative of these words or other similar terms or expressions. You should not put undue reliance on any forward-looking statements. Forward-looking statements should not be read as a guarantee of future performance or results and will not necessarily be accurate indications of the times at, or by, which such performance or results will be achieved, if at all.
Forward-looking statements are based on information available at the time those statements are made and are based on current expectations, estimates, forecasts, and projections as well as the beliefs and assumptions of management as of that time with respect to future events. These statements are subject to risks and uncertainties, many of which involve factors or circumstances that are beyond our control, that could cause actual performance or results to differ materially from those expressed in or suggested by the forward-looking statements. In light of these risks and uncertainties, the forward-looking events and circumstances discussed in this press release may not occur and actual results could differ materially from those anticipated or implied in the forward-looking statements. These risks, uncertainties, assumptions, and other factors include, but are not limited to, those related to our business and financial performance, the effects of adverse global macroeconomic conditions and geopolitical uncertainty, the effects of COVID-19 or other public health crises on our business, results of operations, and financial condition, our ability to attract and retain customers, our ability to develop new products and services and enhance existing products and services, our ability to respond rapidly to emerging technology trends, our ability to execute on our business strategy, including our strategy related to the Informatica IDMC platform and key partnerships, our ability to increase and predict customer consumption of our platform, our ability to compete effectively, and our ability to manage growth.
Further information on these and additional risks, uncertainties, and other factors that could cause actual outcomes and results to differ materially from those included in or contemplated by the forward-looking statements contained in this release are included under the caption “Risk Factors” and elsewhere in our Annual Report on Form 10-K that was filed for the fiscal year ended December 31, 2021, and other filings and reports we make with the Securities and Exchange Commission from time to time, including our Quarterly Report on Form 10-Q that will be filed for the second quarter ended June 30, 2022. All forward-looking statements contained herein are based on information available to us as of the date hereof and we do not assume any obligation to update these statements as a result of new information or future events.
Non-GAAP Financial Measures and Key Business Metrics
We review several operating and financial metrics, including the following unaudited non-GAAP financial measures and key business metrics to evaluate our business, measure our performance, identify trends affecting our business, formulate business plans, and make strategic decisions:
Non-GAAP Financial Measures
In addition to our results determined in accordance with U.S. generally accepted accounting principles (GAAP), we believe the following non-GAAP measures are useful in evaluating our operating performance. We use the following non-GAAP financial measures to evaluate our ongoing operations and for internal planning and forecasting purposes. We believe that these non-GAAP financial measures, when taken collectively, may be helpful to investors because they provide consistency and comparability with past financial performance. However, non-GAAP financial measures are presented for supplemental informational purposes only, have limitations as an analytical tool, and should not be considered in isolation or as a substitute for financial information presented in accordance with GAAP. In addition, other companies, including companies in our industry, may calculate similarly titled non-GAAP measures differently or may use other measures to evaluate their performance, all of which could reduce the usefulness of our non-GAAP financial measures as tools for comparison. A reconciliation is provided below for our non-GAAP financial measures to the most directly comparable financial measures stated in accordance with GAAP. Investors are encouraged to review the related GAAP financial measures and the reconciliation of these non-GAAP financial measures to their most directly comparable GAAP financial measures, and not to rely on any single financial measure to evaluate our business.
Non-GAAP Income from Operations and Non-GAAP Net Income exclude the effect of stock-based compensation expense-related charges, amortization of acquired intangibles, equity compensation related payments, expenses associated with acquisitions, strategic investments and sponsor-related costs, and are adjusted for income tax effects. We believe the presentation of operating results that exclude these non-cash or non-recurring items provides useful supplemental information to investors and facilitates the analysis of our operating results and comparison of operating results across reporting periods.
Adjusted EBITDA represents GAAP net income (loss) as adjusted for income tax benefit (expense), interest income, interest expense, loss on debt refinancing, other income (expense), stock-based compensation, amortization of intangibles, equity compensation related payments, one time fees related to acquisitions, costs related to discrete payments for legal settlements, restructuring costs and executive severance, one-time impairment on restructured facilities, sponsor-related costs, and depreciation. Equity compensation-related payments are related to the repurchase of employee stock options. We believe adjusted EBITDA is an important metric for understanding our business to assess our relative profitability adjusted for balance sheet debt levels.
Unlevered Free Cash Flow (after-tax) represents operating cash flow less purchases of property and equipment and is adjusted for interest payments, equity compensation payments, sponsor management fees, legal settlements, restructuring costs (including payments for impaired leases), and executive severance. We believe this measure provides useful supplemental information to investors because it is an indicator of the strength and performance of our core business operations.
Key Business Metrics
Annual Recurring Revenue (ARR) represents the expected annual billing amounts from all active maintenance and subscription agreements. ARR is calculated based on the contract Monthly Recurring Revenue (MRR) multiplied by 12. MRR is calculated based on the accounting adjusted total contract value divided by the number of months of the agreement based on the start and end dates of each contracted line item. The aggregate ARR calculated at the end of each reported period represents the value of all contracts that are active as of the end of the period, including those contracts that have expired but are still under negotiation for renewal. We typically allow for a grace period of up to 6 months past the original contract expiration quarter during which we engage in the renewal process before we report the contract as lost /inactive. This grace-period ARR amount has been less than 2% of the reported ARR in each period presented. If there is an actual cancellation of an ARR contract, we remove that ARR value at that time. We believe ARR is an important metric for understanding our business since it tracks the annualized cash value collected over a 12-month period for all our recurring contracts, irrespective of whether it is a maintenance contract on a perpetual license, a ratable cloud contract, or an on-premise term-based subscription license.
Maintenance Annual Recurring Revenue represents the portion of ARR only attributable to our maintenance contracts. We believe that Maintenance ARR is a helpful metric for understanding our business since it represents the approximate annualized cash value collected over a 12-month period for all our maintenance contracts. Maintenance ARR includes maintenance contracts supporting our on-premise perpetual licenses. Maintenance ARR should be viewed independently of maintenance revenue and deferred revenue related to our maintenance contracts and is not intended to be combined with or to replace either of those items.
Subscription Annual Recurring Revenue represents the portion of ARR only attributable to our subscription contracts. We believe that Subscription ARR is a helpful metric for understanding our business since it represents the approximate annualized cash value collected over a 12-month period for all our recurring subscription contracts. Subscription ARR excludes maintenance contracts on our perpetual licenses to provide information regarding the period-to-period performance and overall size and scale of our subscription business as we continue to focus our efforts on subscription-based licensing. Subscription ARR should be viewed independently of subscription revenue and deferred revenue related to our subscription contracts and is not intended to be combined with or to replace either of those items.
Cloud Annual Recurring Revenue represents the portion of ARR that is attributable to our hosted cloud contracts. We believe that Cloud ARR is a helpful metric for understanding our business since it represents the approximate annualized cash value collected over a 12-month period for all our recurring Cloud contracts. Cloud ARR is a subset of our overall Subscription ARR, and by providing this breakdown of Cloud ARR, it provides visibility on the size and growth rate of our Cloud ARR within our overall Subscription ARR. Cloud ARR should be viewed independently of subscription revenue and deferred revenue related to our subscription contracts and is not intended to be combined with or to replace either of those items.
Subscription Net Retention Rate compares the contract value for Subscription ARR from the same set of customers at the end of a period compared to the prior year. We treat divisions, segments, or subsidiaries inside companies as separate customers. To calculate our Subscription NRR for a particular period, we first establish the Subscription ARR value at the end of the prior-year period. We subsequently measure the Subscription ARR value at the end of the current period from the same cohort of customers. The net retention rate is then calculated by dividing the aggregate Subscription ARR in the current period by the prior-year period. An increase in the Subscription NRR occurs as a result of price increases on existing contracts, higher consumption of existing products, and sales of additional new subscription products to existing customers exceeding losses from subscription contracts due to cancellations. We believe Subscription NRR is an important metric for understanding our business since it measures the rate at which we are able to sell additional products into our subscription customer base.
Gartner Disclaimer: Gartner Peer Insights content consists of the opinions of individual end users based on their own experiences with the vendors listed on the platform, should not be construed as statements of fact, nor do they represent the views of Gartner or its affiliates. Gartner does not endorse any vendor, product or service depicted in this content nor makes any warranties, expressed or implied, with respect to this content, about its accuracy or completeness, including any warranties of merchantability or fitness for a particular purpose. Gartner does not endorse any vendor, product or service depicted in its research publications and does not advise technology users to select only those vendors with the highest ratings or other designation. Gartner research publications consist of the opinions of Gartner’s Research & Advisory organization and should not be construed as statements of fact. Gartner disclaims all warranties, expressed or implied, with respect to this research, including any warranties of merchantability or fitness for a particular purpose. GARTNER PEER INSIGHTS CUSTOMERS’ CHOICE badge and PEER INSIGHTS are trademarks and service marks, of Gartner, Inc. and/or its affiliates in the U.S. and internationally and are used herein with permission. All rights reserved.
About Informatica
Informatica (NYSE: INFA), an Enterprise Cloud Data Management leader, empowers businesses to realize the transformative power of data. We have pioneered a new category of software, the Informatica Intelligent Data Management Cloud™(IDMC), powered by AI and a cloud-first, cloud-native, end-to-end data management platform that connects, manages, and unifies data across any multi-cloud, hybrid system, empowering enterprises to modernize and advance their data strategies. Over 5,000 customers in more than 100 countries and 85 of the Fortune 100 rely on Informatica to drive data-led digital transformation.
###
Contacts:
Investor Relations:
Victoria Hyde-Dunn
vhydedunn@informatica.com
Media Relations:
Priya Ramesh
priya@informatica.com
INFORMATICA INC.
CONSOLIDATED STATEMENTS OF OPERATIONS
(in thousands, except per share data)
(unaudited)
|
Three Months Ended June 30, |
|
Six Months Ended June 30, |
||||
|
2022 |
|
2021 |
|
2022 |
|
2021 |
|
|
|
|
|
|
|
|
Revenues: |
|
|
|
|
|
|
|
Subscriptions |
$ 207,043 |
|
$ 166,723 |
|
$ 404,790 |
|
$ 324,265 |
Perpetual license |
2,300 |
|
7,023 |
|
4,972 |
|
16,239 |
Software revenue |
209,343 |
|
173,746 |
|
409,762 |
|
340,504 |
Maintenance and professional services |
162,696 |
|
168,079 |
|
324,624 |
|
335,034 |
Total revenues |
372,039 |
|
341,825 |
|
734,386 |
|
675,538 |
Cost of revenues: |
|
|
|
|
|
|
|
Subscriptions |
25,177 |
|
18,758 |
|
49,881 |
|
37,067 |
Perpetual license |
176 |
|
1,160 |
|
329 |
|
2,187 |
Software costs |
25,353 |
|
19,918 |
|
50,210 |
|
39,254 |
Maintenance and professional services |
52,120 |
|
40,788 |
|
101,925 |
|
80,282 |
Amortization of acquired technology |
8,936 |
|
18,496 |
|
18,073 |
|
37,095 |
Total cost of revenues |
86,409 |
|
79,202 |
|
170,208 |
|
156,631 |
Gross profit |
285,630 |
|
262,623 |
|
564,178 |
|
518,907 |
Operating expenses: |
|
|
|
|
|
|
|
Research and development |
84,064 |
|
63,927 |
|
159,187 |
|
123,831 |
Sales and marketing |
143,597 |
|
112,412 |
|
272,549 |
|
220,938 |
General and administrative |
31,632 |
|
28,688 |
|
61,206 |
|
55,306 |
Amortization of intangible assets |
38,459 |
|
43,160 |
|
77,120 |
|
86,386 |
Total operating expenses |
297,752 |
|
248,187 |
|
570,062 |
|
486,461 |
(Loss) income from operations |
(12,122) |
|
14,436 |
|
(5,884) |
|
32,446 |
Interest income |
1,129 |
|
254 |
|
1,495 |
|
534 |
Interest expense |
(16,560) |
|
(36,384) |
|
(29,385) |
|
(72,183) |
Other (expense) income, net |
3,837 |
|
(1,546) |
|
8,057 |
|
14,779 |
Loss before income taxes |
(23,716) |
|
(23,240) |
|
(25,717) |
|
(24,424) |
Income tax expense |
6,790 |
|
11,089 |
|
7,975 |
|
11,900 |
Net Loss |
$ (30,506) |
|
$ (34,329) |
|
$ (33,692) |
|
$ (36,324) |
|
|
|
|
|
|
|
|
Net loss per share attributable to Class A and Class B-1 common stockholders—basic |
$ (0.11) |
|
$ (0.14) |
|
$ (0.12) |
|
$ (0.15) |
Net loss per share attributable to Class A and Class B-1 common stockholders—diluted |
$ (0.11) |
|
$ (0.14) |
|
$ (0.12) |
|
$ (0.15) |
Weighted-average shares used in computing net loss per share1—basic |
280,417 |
|
244,713 |
|
279,599 |
|
244,658 |
Weighted-average shares used in computing net loss per share1—diluted |
280,417 |
|
244,713 |
|
279,599 |
|
244,658 |
1 Amounts for periods prior to the completion of our restructuring transactions on September 30, 2021 have been retrospectively adjusted to give effect to the restructuring transactions described in our Annual Report on Form 10-K for the year ended December 31, 2021 and filed with the SEC on March 24, 2022.
INFORMATICA INC.
CONSOLIDATED STATEMENTS OF CASH FLOWS
(in thousands)
(unaudited)
|
|
Three Months Ended June 30, |
|
Six Months Ended June 30, |
||||
|
|
2022 |
|
2021 |
|
2022 |
|
2021 |
|
|
|
|
|
|
|
|
|
Operating activities: |
|
|
|
|
|
|
|
|
Net loss |
|
$ (30,506) |
|
$ (34,329) |
|
$ (33,692) |
|
$ (36,324) |
Adjustments to reconcile net loss to net cash provided by operating activities: |
|
|
|
|
|
|
|
|
Depreciation and amortization |
|
5,643 |
|
6,229 |
|
11,370 |
|
12,574 |
Non-cash operating lease costs |
|
4,140 |
|
3,958 |
|
8,717 |
|
7,316 |
Stock-based compensation |
|
34,558 |
|
3,308 |
|
63,833 |
|
5,885 |
Deferred income taxes |
|
(51,202) |
|
(36,703) |
|
(57,347) |
|
(43,191) |
Amortization of intangible assets and acquired technology |
|
47,395 |
|
61,656 |
|
95,193 |
|
123,481 |
Gain on sale of investment in equity interest |
|
— |
|
— |
|
— |
|
(110) |
Amortization of debt issuance costs |
|
918 |
|
1,458 |
|
1,837 |
|
2,888 |
Unrealized loss (gain) on remeasurement of debt |
|
— |
|
5,130 |
|
— |
|
(18,497) |
Changes in operating assets and liabilities: |
|
|
|
|
|
|
|
|
Accounts receivable |
|
(37,563) |
|
(5,232) |
|
140,154 |
|
145,475 |
Prepaid expenses and other assets |
|
8,176 |
|
(8,784) |
|
3,691 |
|
(13,246) |
Accounts payable and accrued liabilities |
|
16,289 |
|
32,643 |
|
(110,050) |
|
(62,812) |
Income taxes payable |
|
32,844 |
|
24,841 |
|
14,863 |
|
15,900 |
Contract liabilities |
|
(14,759) |
|
(14,674) |
|
(52,481) |
|
(34,890) |
Net cash provided by operating activities |
|
15,933 |
|
39,501 |
|
86,088 |
|
104,449 |
Investing activities: |
|
|
|
|
|
|
|
|
Purchases of property and equipment |
|
(356) |
|
(555) |
|
(1,000) |
|
(1,293) |
Purchases of investments |
|
(31,442) |
|
(25,511) |
|
(48,668) |
|
(35,370) |
Maturities of investments |
|
23,187 |
|
16,671 |
|
47,301 |
|
28,450 |
Sale of investment in equity interest |
|
— |
|
— |
|
— |
|
110 |
Net cash used in investing activities |
|
(8,611) |
|
(9,395) |
|
(2,367) |
|
(8,103) |
Financing activities: |
|
|
|
|
|
|
|
|
Payments for share repurchases |
|
— |
|
(4,628) |
|
— |
|
(5,381) |
Payment of debt |
|
(4,688) |
|
(5,943) |
|
(4,688) |
|
(11,875) |
Proceeds from issuance of common stock under employee stock purchase plan |
|
— |
|
— |
|
13,644 |
|
— |
Payments of offering costs |
|
(1,580) |
|
— |
|
(2,085) |
|
— |
Payments for dividends related to Class B-2 shares |
|
— |
|
— |
|
(24) |
|
— |
Payments for taxes related to net share settlement of equity awards |
|
— |
|
(915) |
|
— |
|
(1,031) |
Payment of deferred and contingent consideration |
|
— |
|
— |
|
— |
|
(9,023) |
Net activity from derivatives with an other-than-insignificant financing element |
|
(2,548) |
|
(4,735) |
|
(7,134) |
|
(9,354) |
Proceeds from issuance of shares |
|
7,768 |
|
3,137 |
|
12,474 |
|
4,040 |
Net cash (used in) / provided by financing activities |
|
(1,048) |
|
(13,084) |
|
12,187 |
|
(32,624) |
Effect of foreign exchange rate changes on cash, cash equivalents, and restricted cash |
|
(8,374) |
|
(2,753) |
|
(10,803) |
|
829 |
Net (decrease) / increase in cash, cash equivalents, and restricted cash |
|
(2,100) |
|
14,269 |
|
85,105 |
|
64,551 |
Cash, cash equivalents, and restricted cash at beginning of period |
|
545,301 |
|
398,503 |
|
458,096 |
|
348,221 |
Cash, cash equivalents, and restricted cash at end of period |
|
$ 543,201 |
|
$ 412,772 |
|
$ 543,201 |
|
$ 412,772 |
Supplemental disclosures: |
|
|
|
|
|
|
|
|
Cash paid for interest |
|
$ 16,803 |
|
$ 28,354 |
|
$ 30,481 |
|
$ 56,512 |
Cash paid for income taxes, net of refunds |
|
$ 25,149 |
|
$ 22,662 |
|
$ 50,459 |
|
$ 39,192 |
INFORMATICA INC.
NON-GAAP FINANCIAL MEASURES AND KEY BUSINESS METRICS
(in thousands, except per share data)
(unaudited)
RECONCILIATIONS OF GAAP TO NON-GAAP
Reconciliation of GAAP net loss to Non-GAAP net income
|
Three Months Ended June 30, |
|
Six Months Ended June 30, |
||||
|
2022 |
|
2021 |
|
2022 |
|
2021 |
|
|
|
|
|
|
|
|
|
(in thousands) |
|
(in thousands) |
||||
GAAP net loss |
$ (30,506) |
|
$ (34,329) |
|
$ (33,692) |
|
$ (36,324) |
Stock-based compensation |
34,558 |
|
3,308 |
|
63,833 |
|
5,885 |
Amortization of intangibles |
47,395 |
|
61,656 |
|
95,193 |
|
123,481 |
Equity compensation |
45 |
|
56 |
|
128 |
|
(182) |
Restructuring, acquisition and other charges |
— |
|
(205) |
|
— |
|
128 |
Executive severance |
33 |
|
849 |
|
66 |
|
1,699 |
Sponsor-related costs |
— |
|
500 |
|
— |
|
1,000 |
Income tax effect |
(6,622) |
|
1,646 |
|
(22,730) |
|
(11,769) |
Non-GAAP net income |
$ 44,903 |
|
$ 33,481 |
|
$ 102,798 |
|
$ 83,918 |
|
|
|
|
|
|
|
|
Net loss per share: |
|
|
|
|
|
|
|
Net loss per share—basic |
$ (0.11) |
|
$ (0.14) |
|
$ (0.12) |
|
$ (0.15) |
Net loss per share—diluted |
$ (0.11) |
|
$ (0.14) |
|
$ (0.12) |
|
$ (0.15) |
Non-GAAP net income per share—basic |
$ 0.16 |
|
$ 0.14 |
|
$ 0.37 |
|
$ 0.34 |
Non-GAAP net income per share—diluted |
$ 0.16 |
|
$ 0.13 |
|
$ 0.36 |
|
$ 0.34 |
|
|
|
|
|
|
|
|
Share count (in thousands): |
|
|
|
|
|
|
|
Weighted-average shares used in computing Net loss per share—basic |
280,417 |
|
244,713 |
|
279,599 |
|
244,658 |
Weighted-average shares used in computing Net loss per share—diluted |
280,417 |
|
244,713 |
|
279,599 |
|
244,658 |
Weighted-average shares used in computing Non-GAAP net income per share—basic |
280,417 |
|
244,713 |
|
279,599 |
|
244,658 |
Weighted-average shares used in computing Non-GAAP net income per share—diluted |
284,028 |
|
248,525 |
|
284,335 |
|
247,895 |
Reconciliation of GAAP income from operations to Non-GAAP income from operations
|
Three Months Ended June 30, |
|
Six Months Ended June 30, |
||||
|
2022 |
|
2021 |
|
2022 |
|
2021 |
|
|
|
|
|
|
|
|
|
(in thousands) |
|
(in thousands) |
||||
GAAP (loss) income from operations |
$ (12,122) |
|
$ 14,436 |
|
$ (5,884) |
|
$ 32,446 |
Stock-based compensation |
34,558 |
|
3,308 |
|
63,833 |
|
5,885 |
Amortization of intangibles |
47,395 |
|
61,656 |
|
95,193 |
|
123,481 |
Equity compensation |
45 |
|
56 |
|
128 |
|
(182) |
Restructuring, acquisition and other charges |
— |
|
(205) |
|
— |
|
128 |
Sponsor-related costs |
— |
|
500 |
|
— |
|
1,000 |
Non-GAAP income from operations |
$ 69,876 |
|
$ 79,751 |
|
$ 153,270 |
|
$ 162,758 |
INFORMATICA INC.
NON-GAAP FINANCIAL MEASURES AND KEY BUSINESS METRICS
Adjusted EBITDA Reconciliation
|
Three Months Ended June 30, |
|
Six Months Ended June 30, |
|
Trailing Twelve Months ("TTM") Ended June 30, |
||||
|
2022 |
|
2021 |
|
2022 |
|
2021 |
|
2022 |
|
|
|
|
|
|
|
|
|
|
|
(in thousands) |
|
(in thousands) |
|
(in thousands) |
||||
GAAP net loss |
$ (30,506) |
|
$ (34,329) |
|
$ (33,692) |
|
$ (36,324) |
|
$ (97,297) |
Income tax expense |
6,790 |
|
11,089 |
|
7,975 |
|
11,900 |
|
20,114 |
Interest income |
(1,129) |
|
(254) |
|
(1,495) |
|
(534) |
|
(2,174) |
Interest expense |
16,560 |
|
36,384 |
|
29,385 |
|
72,183 |
|
89,641 |
Loss on debt refinancing |
— |
|
— |
|
— |
|
— |
|
30,882 |
Other (expense) income, net |
(3,837) |
|
1,546 |
|
(8,057) |
|
(14,779) |
|
(19,590) |
Stock-based compensation |
34,558 |
|
3,308 |
|
63,833 |
|
5,885 |
|
102,965 |
Amortization of intangibles |
47,395 |
|
61,656 |
|
95,193 |
|
123,481 |
|
217,607 |
Equity compensation |
45 |
|
56 |
|
128 |
|
(182) |
|
300 |
Restructuring, acquisition and other charges |
— |
|
(205) |
|
— |
|
128 |
|
— |
Sponsor-related costs |
— |
|
500 |
|
— |
|
1,000 |
|
644 |
Depreciation |
5,469 |
|
6,165 |
|
11,194 |
|
12,510 |
|
23,523 |
Adjusted EBITDA |
$ 75,345 |
|
$ 85,916 |
|
$ 164,464 |
|
$ 175,268 |
|
$ 366,615 |
Unlevered Free Cash Flows
|
Three Months Ended June 30, |
|
Six Months Ended June 30, |
||||
|
2022 |
|
2021 |
|
2022 |
|
2021 |
|
|
|
|
|
|
|
|
|
(in thousands, except percentages) |
|
(in thousands, except percentages) |
||||
Total GAAP Revenue |
$ 372,039 |
|
$ 341,825 |
|
$ 734,386 |
|
$ 675,538 |
Net cash provided by operating activities |
$ 15,933 |
|
$ 39,501 |
|
$ 86,088 |
|
$ 104,449 |
Less: Purchases of property, plant, and equipment |
(356) |
|
(555) |
|
(1,000) |
|
(1,293) |
Add: Cash paid for interest |
16,803 |
|
28,354 |
|
30,481 |
|
56,512 |
Add: Equity compensation payments |
165 |
|
327 |
|
345 |
|
767 |
Add: Executive severance |
— |
|
— |
|
3,919 |
|
578 |
Add: Restructuring costs |
186 |
|
1,363 |
|
393 |
|
2,770 |
Add: Sponsor management fees |
— |
|
500 |
|
— |
|
1,000 |
Unlevered Free Cash Flows (after-tax)(1) |
$ 32,731 |
|
$ 69,490 |
|
$ 120,226 |
|
$ 164,783 |
Unlevered Free Cash Flows (after-tax) margin(1) |
9 % |
|
20 % |
|
16 % |
|
24 % |
(1) Includes cash tax payments of $25.1 million and $22.7 million for the three months ended June 30, 2022 and 2021, respectively and $50.5 million and $39.2 million for the six months ended June 30, 2022 and 2021, respectively.
Key Business Metrics
|
June 30, |
||
|
2022 |
|
2021 |
|
|
|
|
|
(in thousands, except percentages) |
||
Total Annual Recurring Revenue |
$ 1,436,826 |
|
$ 1,239,975 |
Maintenance Annual Recurring Revenue |
$ 540,708 |
|
$ 553,950 |
Subscription Annual Recurring Revenue |
$ 896,118 |
|
$ 686,025 |
Cloud Annual Recurring Revenue |
$ 373,303 |
|
$ 263,558 |
Subscription Net Retention Rate |
113 % |
|
116 % |
INFORMATICA INC.
SUPPLEMENTAL INFORMATION
Additional Business Metrics
|
June 30, |
||
|
2022 |
|
2021 |
Maintenance Renewal Rate |
95 % |
|
94 % |
Subscription Renewal Rate |
94 % |
|
93 % |
Customers that spend more than $1 million in Subscription Annual Recurring Revenue(1) |
175 |
|
116 |
Customers that spend more than $100,000 in Subscription Annual Recurring Revenue(2) |
1,791 |
|
1,498 |
Cloud transactions processed per month in trillions(3) |
38.5 |
|
21.7 |
(1) Total number of customers that spend more than $1 million in Subscription Annual Recurring Revenue.
(2) Total number of customers that spend more than $100,000 in Subscription Annual Recurring Revenue.
(3) Total number of cloud transactions processed on our platform per month in trillions, which measures data processed.
Net Debt Reconciliation
|
June 30, |
|
December 31 |
|
2022 |
|
2021 |
|
|
|
|
|
(in millions) |
||
Dollar Term Loan |
$ 1,870 |
|
$ 1,875 |
Less: Cash, cash equivalents, and short-term investments |
(582) |
|
(496) |
Total net debt |
$ 1,288 |
|
$ 1,379 |


