
Informatica Reports Fourth Quarter and Full-Year 2022 Financial Results
- Informatica exceeds the high end of guidance for quarterly and full-year 2022 Subscription Annualized Recurring Revenue (ARR) and Cloud ARR
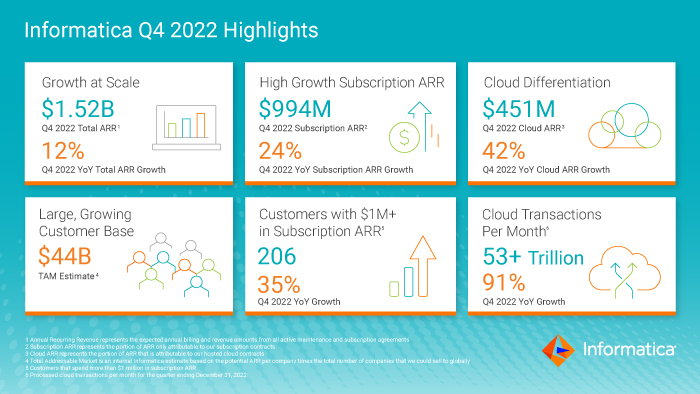
- Record quarterly and full-year 2022 Subscription ARR of $994 million, an increase of 24% year-over-year
- Record quarterly and full-year 2022 Cloud ARR of $451 million, an increase of 42% year-over-year
REDWOOD CITY, CA, February 8, 2023 — Informatica (NYSE: INFA), an enterprise cloud data management leader, today announced financial results for its fourth quarter and full-year 2022, ended December 31, 2022.
“Our solid fourth-quarter performance capped a year in which we delivered cloud ARR and subscription ARR above expectations. We achieved new annual milestones that surpassed $1.5 billion in total ARR and total revenues and $450 million in cloud ARR. Our performance demonstrates the durability of our business model and our diligent execution to deliver balanced growth and profitability,” said Amit Walia, Chief Executive Officer at Informatica. “Looking ahead, we are focusing on a cloud-only, consumption-driven strategy that is part of a multi-year plan driving new cloud business. With this strategy, we expect to streamline operational efforts as we aim to significantly improve operating leverage in 2023 and beyond.”
Fourth Quarter 2022 Financial Highlights:
- GAAP Total Revenues decreased 2% year-over-year to $398.8 million. Fourth quarter total revenues included a negative impact of approximately $15.8 million from foreign currency exchange rates ("FX") year-over-year.
- GAAP Subscription Revenues increased 4% year-over-year to $238.4 million.
- GAAP Operating Income of $28.9 million and Non-GAAP Operating Income of $113.7 million.
- GAAP Operating Income of $28.9 million and Non-GAAP Operating Income of $113.7 million.
- GAAP Operating Cash Flow of $60.7 million.
- Unlevered Free Cash Flow (after-tax) of $91.5 million.
Full-Year 2022 Financial Highlights:
- GAAP Total Revenues increased 4% year-over-year to $1.5 billion. Full-year total revenues included a negative impact of approximately $48.1 million from FX year-over-year.
- GAAP Subscription Revenues increased 15% year-over-year to $857.2 million.
- Total ARR increased 12% year-over-year to $1.52 billion. Full-year total ARR included a negative impact of approximately $20.1 million from FX year-over-year.
- GAAP Operating Income of $25.6 million and Non-GAAP Operating Income of $350.6 million.
- GAAP Operating Cash Flow of $200.1 million.
- Unlevered Free Cash Flow (after-tax) of $288.5 million.
A reconciliation of GAAP to non-GAAP financial measures has been provided in the tables included in this press release. An explanation of these measures is also included below under the heading “Non-GAAP Financial Measures.”
Fourth Quarter 2022 Business Highlights:
- Achieved a subscription net retention rate of 111% at the end of December 31, 2022.
- Processed 53.0 trillion cloud transactions per month for the quarter ended December 31, 2022, as compared to 27.8 trillion cloud transactions per month in the same quarter last year, an increase of 91% year-over-year.
- Reported 206 customers that spend more than $1 million in subscription ARR at the end of December 31, 2022, an increase of 35% year-over-year.
- Reported 1,916 customers that spend more than $100,000 in subscription ARR at the end of December 31, 2022, an increase of 15% year-over-year.
Product Innovation:
- Launched Informatica Data Management Cloud (IDMC) for State and Local Governments vertical to further enable governmental departments to modernize their data infrastructure with an AI-powered, secure, and scalable solution to make data-led decisions.
- Expanded Software-as-a-Service (SaaS) version of multidomain Master Data Management (MDM) to Asia with Microsoft Azure, serving broader Asia Pacific and Japan markets as customer demand for multitenant cloud MDM solution increases.
- Launched Informatica Data Loader for Amazon Redshift enabling customers with the ability to ingest data from AWS and third-party applications to load and combine data in their data warehouse.
- Launched Informatica Data Marketplace support for AWS Data Exchange offering customers a self-service data marketplace.
- Launched INFACore support for Amazon SageMaker Studio to simplify the development and management of data pipelines for building and deploying machine learning models.
Industry Recognition:
- Recognized as a Leader in the 2022 Gartner® Magic Quadrant™ for Data Quality Solutions report. This makes 15 consecutive times of being a Leader, and Informatica is once again positioned highest on the ability to execute axis.
- Scored highest in three data quality use cases in the 2022 Gartner® Critical Capabilities for Data Quality Solutions report.
- Received “Strong” rating by Gartner in Product/Services and Support/Account Management in 2022 Gartner® Vendor Rating report.
- Recognized as Design Partner of the Year and Data & Analytics Partner of the Year at AWS re:Invent 2022.
- Named among 2023 Best Places to Work in IT by Computerworld.
- Named a Winner at the 2022 Digital Innovator Award from industry analyst Intellyx.
- Named a Champion in Bloor Research 2022 Sensitive Data Market Update report.
- Named a Leader in the GigaOm Radar for Data Catalogs report.
Leadership Update:
- Appointed Michael McLaughlin as Chief Financial Officer. Mr. McLaughlin is a seasoned finance executive with 30 years of experience in the finance and technology industries.
First Quarter and Full-Year 2023 Financial Outlook
The Company provides the financial guidance below based on current market conditions and expectations and is subject to various important cautionary factors described below. Guidance includes the impact from macroeconomic conditions and foreign exchange headwinds. Based on information available as of February 8, 2023, guidance for the first quarter 2023 and full-year 2023 is as follows:
First Quarter 2023 Ending March 31, 2023:
- GAAP Total Revenues are expected to be in the range of $352 million to $362 million, representing approximately a 1% year-over-year decrease at the midpoint of the range.
- Subscription ARR is expected to be in the range of $1,005 million to $1,015 million, representing approximately 19% year-over-year growth at the midpoint of the range.
- Cloud ARR is expected to be in the range of $462 million to $468 million, representing approximately 35% year-over-year growth at the midpoint of the range.
- Non-GAAP Operating Income is expected to be in the range of $74 million to $84 million, representing approximately a 5% year-over-year decrease at the midpoint of the range.
Full-Year 2023 Ending December 31, 2023:
- GAAP Total Revenues are expected to be in the range of $1,570 million to $1,590 million, representing approximately 5% year-over-year growth at the midpoint of the range.
- Total ARR is expected to be in the range of $1,585 million to $1,615 million, representing approximately 5% year-over-year growth at the midpoint of the range.
- Subscription ARR is expected to be in the range of $1,098 million to $1,118 million, representing approximately 11% year-over-year growth at the midpoint of the range.
- Cloud ARR is expected to be in the range of $604 million to $614 million, representing approximately 35% year-over-year growth at the midpoint of the range.
- Non-GAAP Operating Income is expected to be in the range of $400 million to $420 million, representing approximately 17% year-over-year growth at the midpoint of the range.
- Unlevered Free Cash Flow (after-tax) is expected to be in the range of $340 million to $360 million, representing approximately 21% year-over-year growth at the midpoint of the range.
The Company is assuming constant FX rates for the year based on the rates at the start of the planning period. For reference purposes, the assumed FX rates for our top four currencies in full-year 2023 are as follows:
Currency |
Planned Rate |
|
EUR/$ |
1.07 |
|
GBP/$ |
1.20 |
|
$/CAD |
1.35 |
|
$/JPY |
132 |
Using the foreign exchange rate assumptions noted above, the Company has incorporated the following FX impact into 2023 guidance:
|
Q1 2023 |
Full-Year 2023 |
||
Total Revenues |
~$7m negative impact y/y |
~$1m negative impact y/y |
||
Total ARR |
~$5m negative impact y/y |
~$11m negative impact y/y |
||
Subscription ARR |
~$2m negative impact y/y |
~$8m negative impact y/y |
||
Cloud ARR |
— |
~$3m negative impact y/y |
In addition to the above guidance, the Company is also providing a first quarter and full-year 2023 weighted-average number of basic and diluted share estimates for modeling purposes. For the first quarter 2023, we expect basic weighted-average shares outstanding to be approximately 285 million shares and diluted weighted-average shares outstanding to be approximately 288 million shares. For the full-year 2023, we expect basic weighted-average shares outstanding to be approximately 289 million shares and diluted weighted-average shares outstanding to be approximately 298 million shares.
Reconciliation of non-GAAP operating income and unlevered free cash flow after-tax guidance to the most directly comparable GAAP measures is not available without unreasonable effort, as certain items cannot be reasonably predicted because of their high variability, complexity, and low visibility. In particular, the measures and effects of our stock-based compensation expense specific to our equity compensation awards and employer payroll tax-related items on employee stock transactions are directly impacted by the timing of employee stock transactions and unpredictable fluctuations in our stock price, which we expect to have a significant impact on our future GAAP financial results.
Webcast and Conference Call
A conference call to discuss Informatica’s fourth quarter and full-year 2022 financial results and financial outlook for the first quarter and full-year 2023 is scheduled for 1:30 p.m. Pacific Time today. To participate, please dial 1-844-200-6205 from the U.S. or 1-646-904-5544 from international locations. The conference passcode is 830565. A live webcast of the conference call will be available on the Investor Relations section of Informatica’s website at investors.informatica.com where presentation materials will also be posted prior to the conference call. A replay will be available online approximately two hours following the live call for a period of 30 days.
Forward-Looking Statements
This press release and the related conference call and webcast contain forward-looking statements within the meaning of Section 27A of the Securities Act of 1933, as amended, and Section 21E of the Securities Exchange Act of 1934, as amended. These statements may relate to, but are not limited to, expectations of future operating results or financial performance, including expectations regarding GAAP and non-GAAP guidance for the first quarter and 2023 fiscal year, the effect of foreign currency exchange rates, the effect of macroeconomic conditions, management’s plans, priorities, initiatives, and strategies, and management's estimates and expectations regarding growth of our business, market, and partnerships. Forward-looking statements are inherently subject to risks and uncertainties, some of which cannot be predicted or quantified. In some cases, you can identify forward-looking statements because they contain words such as “anticipate,” “believe,” “contemplate,” “continue,” “could,” “estimate,” “expect,” “intend,” “may,” “plan,” “potential,” “predict,” “project,” “should,” “target,” “toward,” “will,” or “would,” or the negative of these words or other similar terms or expressions. You should not put undue reliance on any forward-looking statements. Forward-looking statements should not be read as a guarantee of future performance or results and will not necessarily be accurate indications of the times at, or by, which such performance or results will be achieved, if at all.
Forward-looking statements are based on information available at the time those statements are made and are based on current expectations, estimates, forecasts, and projections as well as the beliefs and assumptions of management as of that time with respect to future events. These statements are subject to risks and uncertainties, many of which involve factors or circumstances that are beyond our control, that could cause actual performance or results to differ materially from those expressed in or suggested by the forward-looking statements. In light of these risks and uncertainties, the forward-looking events and circumstances discussed in this press release may not occur and actual results could differ materially from those anticipated or implied in the forward-looking statements. These risks, uncertainties, assumptions, and other factors include, but are not limited to, those related to our business and financial performance, the effects of adverse global macroeconomic conditions and geopolitical uncertainty, the effects of COVID-19 or other public health crises on our business, results of operations, and financial condition, our ability to attract and retain customers, our ability to develop new products and services and enhance existing products and services, our ability to respond rapidly to emerging technology trends, our ability to execute on our business strategy, including our strategy related to the Informatica IDMC platform and key partnerships, our ability to increase and predict customer consumption of our platform, our ability to compete effectively, and our ability to manage growth.
Further information on these and additional risks, uncertainties, and other factors that could cause actual outcomes and results to differ materially from those included in or contemplated by the forward-looking statements contained in this release are included under the caption “Risk Factors” and elsewhere in our Quarterly Report on Form 10-Q that was filed for the third quarter ended September 30, 2022, and other filings and reports we make with the Securities and Exchange Commission from time to time, including our Annual Report on Form 10-K that will be filed for the fiscal year ended December 31, 2022. All forward-looking statements contained herein are based on information available to us as of the date hereof and we do not assume any obligation to update these statements as a result of new information or future events.
Non-GAAP Financial Measures and Key Business Metrics
We review several operating and financial metrics, including the following unaudited non-GAAP financial measures and key business metrics to evaluate our business, measure our performance, identify trends affecting our business, formulate business plans, and make strategic decisions:
Non-GAAP Financial Measures
In addition to our results determined in accordance with U.S. generally accepted accounting principles (GAAP), we believe the following non-GAAP measures are useful in evaluating our operating performance. We use the following non-GAAP financial measures to evaluate our ongoing operations and for internal planning and forecasting purposes. We believe that these non-GAAP financial measures, when taken collectively, may be helpful to investors because they provide consistency and comparability with past financial performance. However, non-GAAP financial measures are presented for supplemental informational purposes only, have limitations as an analytical tool, and should not be considered in isolation or as a substitute for financial information presented in accordance with GAAP. In addition, other companies, including companies in our industry, may calculate similarly titled non-GAAP measures differently or may use other measures to evaluate their performance, all of which could reduce the usefulness of our non-GAAP financial measures as tools for comparison. A reconciliation is provided below for our non-GAAP financial measures to the most directly comparable financial measures stated in accordance with GAAP. Investors are encouraged to review the related GAAP financial measures and the reconciliation of these non-GAAP financial measures to their most directly comparable GAAP financial measures, and not to rely on any single financial measure to evaluate our business.
Non-GAAP Income from Operations and Non-GAAP Net Income exclude the effect of stock-based compensation expense-related charges, amortization of acquired intangibles, equity compensation related payments, expenses associated with acquisitions, strategic investments and sponsor-related costs, and are adjusted for income tax effects. We believe the presentation of operating results that exclude these non-cash or non-recurring items provides useful supplemental information to investors and facilitates the analysis of our operating results and comparison of operating results across reporting periods.
Adjusted EBITDA represents GAAP net income (loss) as adjusted for income tax benefit (expense), interest income, interest expense, loss on debt refinancing, other income (expense), stock-based compensation, amortization of intangibles, equity compensation related payments, one time fees related to acquisitions, costs related to discrete payments for legal settlements, restructuring costs and executive severance, one-time impairment on restructured facilities, sponsor-related costs, and depreciation. Equity compensation-related payments are related to the repurchase of employee stock options. We believe adjusted EBITDA is an important metric for understanding our business to assess our relative profitability adjusted for balance sheet debt levels.
Unlevered Free Cash Flow (after-tax) represents operating cash flow less purchases of property and equipment and is adjusted for interest payments, equity compensation payments, sponsor management fees, legal settlements, restructuring costs (including payments for impaired leases), and executive severance. We believe this measure provides useful supplemental information to investors because it is an indicator of the strength and performance of our core business operations.
Key Business Metrics
Annual Recurring Revenue (ARR) represents the expected annual billing amounts from all active maintenance and subscription agreements. ARR is calculated based on the contract Monthly Recurring Revenue (MRR) multiplied by 12. MRR is calculated based on the accounting adjusted total contract value divided by the number of months of the agreement based on the start and end dates of each contracted line item. The aggregate ARR calculated at the end of each reported period represents the value of all contracts that are active as of the end of the period, including those contracts that have expired but are still under negotiation for renewal. We typically allow for a grace period of up to 6 months past the original contract expiration quarter during which we engage in the renewal process before we report the contract as lost/inactive. This grace-period ARR amount has been less than 2% of the reported ARR in each period presented. If there is an actual cancellation of an ARR contract, we remove that ARR value at that time. We believe ARR is an important metric for understanding our business since it tracks the annualized cash value collected over a 12-month period for all our recurring contracts, irrespective of whether it is a maintenance contract on a perpetual license, a ratable cloud contract, or an on-premise term-based subscription license.
Maintenance Annual Recurring Revenue represents the portion of ARR only attributable to our maintenance contracts. We believe that Maintenance ARR is a helpful metric for understanding our business since it represents the approximate annualized cash value collected over a 12-month period for all our maintenance contracts. Maintenance ARR includes maintenance contracts supporting our on-premise perpetual licenses. Maintenance ARR should be viewed independently of maintenance revenue and deferred revenue related to our maintenance contracts and is not intended to be combined with or to replace either of those items.
Subscription Annual Recurring Revenue represents the portion of ARR only attributable to our subscription contracts. We believe that Subscription ARR is a helpful metric for understanding our business since it represents the approximate annualized cash value collected over a 12-month period for all our recurring subscription contracts. Subscription ARR excludes maintenance contracts on our perpetual licenses to provide information regarding the period-to-period performance and overall size and scale of our subscription business as we continue to focus our efforts on subscription-based licensing. Subscription ARR should be viewed independently of subscription revenue and deferred revenue related to our subscription contracts and is not intended to be combined with or to replace either of those items.
Cloud Annual Recurring Revenue represents the portion of ARR that is attributable to our hosted cloud contracts. We believe that Cloud ARR is a helpful metric for understanding our business since it represents the approximate annualized cash value collected over a 12-month period for all our recurring Cloud contracts. Cloud ARR is a subset of our overall Subscription ARR, and by providing this breakdown of Cloud ARR, it provides visibility on the size and growth rate of our Cloud ARR within our overall Subscription ARR. Cloud ARR should be viewed independently of subscription revenue and deferred revenue related to our subscription contracts and is not intended to be combined with or to replace either of those items.
Subscription Net Retention Rate compares the contract value for Subscription ARR from the same set of customers at the end of a period compared to the prior year. We treat divisions, segments, or subsidiaries inside companies as separate customers. To calculate our Subscription NRR for a particular period, we first establish the Subscription ARR value at the end of the prior-year period. We subsequently measure the Subscription ARR value at the end of the current period from the same cohort of customers. The net retention rate is then calculated by dividing the aggregate Subscription ARR in the current period by the prior-year period. An increase in the Subscription NRR occurs as a result of price increases on existing contracts, higher consumption of existing products, and sales of additional new subscription products to existing customers exceeding losses from subscription contracts due to cancellations. We believe Subscription NRR is an important metric for understanding our business since it measures the rate at which we are able to sell additional products into our subscription customer base.
Gartner Disclaimer: Gartner does not endorse any vendor, product or service depicted in its research publications, and does not advise technology users to select only those vendors with the highest ratings or other designation. Gartner research publications consist of the opinions of Gartner’s research organization and should not be construed as statements of fact. Gartner disclaims all warranties, expressed or implied, with respect to this research, including any warranties of merchantability or fitness for a particular purpose. Gartner and Magic Quadrant are a registered trademark of Gartner, Inc. and/or its affiliates in the U.S. and internationally and are used herein with permission. All rights reserved.
About Informatica
Informatica (NYSE: INFA), an Enterprise Cloud Data Management leader, brings data to life by empowering businesses to realize the transformative power of their most critical information. We have pioneered a new category of software, the Informatica Intelligent Data Management Cloud™ (IDMC), powered by AI and an end-to-end data management platform that connects, manages and unifies data across any multi-cloud, hybrid system, democratizing data to modernize and advance their business strategies. Customers in more than 100 countries and 85 of the Fortune 100 rely on Informatica to drive data-led digital transformation. Informatica. Where data comes to life.
###
Contacts:
Investor Relations:
Victoria Hyde-Dunn
vhydedunn@informatica.com
Media Relations:
prteam@informatica.com
INFORMATICA INC. CONSOLIDATED STATEMENTS OF OPERATIONS (in thousands, except per share data) (Unaudited) |
||||||||||||||||
|
Three Months Ended December 31, |
|
Twelve Months Ended December 31, |
|||||||||||||
|
2022 |
|
2021 |
|
2022 |
|
2021 |
|||||||||
|
|
|
|
|||||||||||||
Revenues: |
|
|
|
|
|
|
|
|||||||||
Subscriptions |
$ |
238,364 |
|
|
$ |
229,717 |
|
|
$ |
857,163 |
|
|
$ |
747,672 |
|
|
Perpetual license |
|
4,217 |
|
|
|
10,184 |
|
|
|
10,397 |
|
|
|
29,269 |
|
|
Software revenue |
|
242,581 |
|
|
|
239,901 |
|
|
|
867,560 |
|
|
|
776,941 |
|
|
Maintenance and professional services |
|
156,200 |
|
|
|
166,809 |
|
|
|
637,558 |
|
|
|
667,114 |
|
|
Total revenues |
|
398,781 |
|
|
|
406,710 |
|
|
|
1,505,118 |
|
|
|
1,444,055 |
|
|
Cost of revenues: |
|
|
|
|
|
|
|
|||||||||
Subscriptions |
|
27,814 |
|
|
|
23,398 |
|
|
|
105,387 |
|
|
|
81,266 |
|
|
Perpetual license |
|
160 |
|
|
|
1,152 |
|
|
|
636 |
|
|
|
4,452 |
|
|
Software costs |
|
27,974 |
|
|
|
24,550 |
|
|
|
106,023 |
|
|
|
85,718 |
|
|
Maintenance and professional services |
|
49,552 |
|
|
|
52,223 |
|
|
|
202,126 |
|
|
|
172,820 |
|
|
Amortization of acquired technology |
|
8,578 |
|
|
|
18,013 |
|
|
|
35,354 |
|
|
|
73,461 |
|
|
Total cost of revenues |
|
86,104 |
|
|
|
94,786 |
|
|
|
343,503 |
|
|
|
331,999 |
|
|
Gross profit |
|
312,677 |
|
|
|
311,924 |
|
|
|
1,161,615 |
|
|
|
1,112,056 |
|
|
Operating expenses: |
|
|
|
|
|
|
|
|||||||||
Research and development |
|
79,179 |
|
|
|
73,750 |
|
|
|
318,769 |
|
|
|
260,660 |
|
|
Sales and marketing |
|
130,849 |
|
|
|
159,117 |
|
|
|
535,680 |
|
|
|
496,816 |
|
|
General and administrative |
|
35,631 |
|
|
|
37,303 |
|
|
|
128,092 |
|
|
|
122,112 |
|
|
Amortization of intangible assets |
|
38,120 |
|
|
|
42,951 |
|
|
|
153,471 |
|
|
|
172,434 |
|
|
Restructuring, acquisition and other charges |
|
— |
|
|
|
— |
|
|
|
— |
|
|
|
128 |
|
|
Total operating expenses |
|
283,779 |
|
|
|
313,121 |
|
|
|
1,136,012 |
|
|
|
1,052,150 |
|
|
Income (loss) from operations |
|
28,898 |
|
|
|
(1,197 |
) |
|
|
25,603 |
|
|
|
59,906 |
|
|
Interest income |
|
4,916 |
|
|
|
368 |
|
|
|
9,224 |
|
|
|
1,213 |
|
|
Interest expense |
|
(26,450 |
) |
|
|
(23,833 |
) |
|
|
(78,020 |
) |
|
|
(132,439 |
) |
|
Loss on debt refinancing |
|
— |
|
|
|
(30,882 |
) |
|
|
— |
|
|
|
(30,882 |
) |
|
Other (expense) income, net |
|
(3,024 |
) |
|
|
(2,432 |
) |
|
|
8,996 |
|
|
|
26,312 |
|
|
Income (loss) before income taxes |
|
4,340 |
|
|
|
(57,976 |
) |
|
|
(34,197 |
) |
|
|
(75,890 |
) |
|
Income tax expense |
|
8,721 |
|
|
|
8,356 |
|
|
|
19,478 |
|
|
|
24,039 |
|
|
Net loss |
$ |
(4,381 |
) |
|
$ |
(66,332 |
) |
|
$ |
(53,675 |
) |
|
$ |
(99,929 |
) |
|
|
|
|
|
|
|
|
|
|||||||||
Net loss per share attributable to Class A and Class B-1 common stockholders - basic |
$ |
(0.02 |
) |
|
$ |
(0.25 |
) |
|
$ |
(0.19 |
) |
|
$ |
(0.40 |
) |
|
Net loss per share attributable to Class A and Class B-1 common stockholders - diluted |
$ |
(0.02 |
) |
|
$ |
(0.25 |
) |
|
$ |
(0.19 |
) |
|
$ |
(0.40 |
) |
|
Weighted-average shares used in computing net loss per share1 - basic |
|
283,410 |
|
|
|
267,473 |
|
|
|
281,129 |
|
|
|
250,418 |
|
|
Weighted-average shares used in computing net loss per share1 -diluted |
|
283,410 |
|
|
|
267,473 |
|
|
|
281,129 |
|
|
|
250,418 |
|
|
1 Amounts for periods prior to the completion of our restructuring transactions on September 30, 2021 have been retrospectively adjusted to give effect to the restructuring transactions described in our Form S-1 and final prospectus dated October 26, 2021 and filed with the SEC pursuant to Rule 424(b)(4) on October 27, 2021 ("Final Prospectus"). |
INFORMATICA INC. CONSOLIDATED BALANCE SHEETS (in thousands, except par value data) (Unaudited) |
||||||||
|
December 31, |
|
December 31, |
|||||
|
2022 |
|
2021 |
|||||
|
|
|
|
|||||
Assets |
|
|
|
|||||
Current assets: |
|
|
|
|||||
Cash and cash equivalents |
$ |
497,879 |
|
|
$ |
456,378 |
|
|
Short-term investments |
|
218,256 |
|
|
|
40,045 |
|
|
Accounts receivable, net of allowances of $4,608 and $4,644, respectively |
|
454,759 |
|
|
|
432,266 |
|
|
Contract assets, net |
|
95,221 |
|
|
|
109,269 |
|
|
Prepaid expenses and other current assets |
|
132,638 |
|
|
|
133,832 |
|
|
Total current assets |
|
1,398,753 |
|
|
|
1,171,790 |
|
|
Restricted cash |
|
— |
|
|
|
1,718 |
|
|
Property and equipment, net |
|
160,574 |
|
|
|
177,409 |
|
|
Operating lease right-of-use-assets |
|
67,735 |
|
|
|
74,789 |
|
|
Goodwill |
|
2,337,036 |
|
|
|
2,380,752 |
|
|
Customer relationships intangible asset, net |
|
794,898 |
|
|
|
948,556 |
|
|
Other intangible assets, net |
|
33,094 |
|
|
|
78,899 |
|
|
Deferred tax assets |
|
13,076 |
|
|
|
13,196 |
|
|
Other assets |
|
165,733 |
|
|
|
139,154 |
|
|
Total assets |
$ |
4,970,899 |
|
|
$ |
4,986,263 |
|
|
Liabilities and Stockholders’ Equity |
|
|
|
|||||
Current liabilities: |
|
|
|
|||||
Accounts payable |
$ |
38,002 |
|
|
$ |
41,755 |
|
|
Accrued liabilities |
|
58,844 |
|
|
|
74,763 |
|
|
Accrued compensation and related expenses |
|
150,118 |
|
|
|
171,978 |
|
|
Current operating lease liabilities |
|
17,514 |
|
|
|
18,505 |
|
|
Current portion of long-term debt |
|
18,750 |
|
|
|
14,063 |
|
|
Income taxes payable |
|
3,758 |
|
|
|
7,211 |
|
|
Contract liabilities |
|
676,470 |
|
|
|
613,336 |
|
|
Total current liabilities |
|
963,456 |
|
|
|
941,611 |
|
|
Long-term operating lease liabilities |
|
55,178 |
|
|
|
62,519 |
|
|
Long-term contract liabilities |
|
23,007 |
|
|
|
28,651 |
|
|
Long-term debt, net |
|
1,821,760 |
|
|
|
1,837,408 |
|
|
Deferred tax liabilities |
|
18,604 |
|
|
|
104,788 |
|
|
Long-term income taxes payable |
|
30,601 |
|
|
|
23,833 |
|
|
Other liabilities |
|
3,932 |
|
|
|
3,777 |
|
|
Total liabilities |
|
2,916,538 |
|
|
|
3,002,587 |
|
|
Stockholders’ equity: |
|
|
|
|||||
Class A common stock; $0.01 par value per share; 2,000,000 and 2,000,000 shares authorized as of December 31, 2022 and December 31, 2021, respectively; Total of 239,749 and 234,189 shares issued and outstanding as of December 31, 2022 and December 31, 2021, respectively1 |
|
2,398 |
|
|
|
2,343 |
|
|
Class B-1 common stock; $0.01 par value per share; 200,000 and 200,000 shares authorized as of December 31, 2022 and December 31, 2021, respectively; Total of 44,050 shares issued and outstanding as of December 31, 2022 and December 31, 2021, respectively1 |
|
440 |
|
|
|
440 |
|
|
Class B-2 common stock; $0.00001 par value per share, 200,000 and 200,000 shares authorized as of December 31, 2022 and December 31, 2021, respectively; Total of 44,050 shares issued and outstanding as of December 31, 2022 and December 31, 2021, respectively1 |
|
— |
|
|
|
— |
|
|
Additional paid-in-capital1 |
|
3,282,383 |
|
|
|
3,093,232 |
|
|
Accumulated other comprehensive (expense) income |
|
(47,671 |
) |
|
|
17,151 |
|
|
Accumulated deficit |
|
(1,183,189 |
) |
|
|
(1,129,490 |
) |
|
Total stockholders’ equity |
|
2,054,361 |
|
|
|
1,983,676 |
|
|
Total liabilities and stockholders’ equity |
$ |
4,970,899 |
|
|
$ |
4,986,263 |
|
|
|
|
|
||||||
| 1 Amounts for periods prior to the completion of our restructuring transactions on September 30, 2021 have been retrospectively adjusted to give effect to the restructuring transactions described in our Form S-1 and final prospectus dated October 26, 2021 and filed with the SEC pursuant to Rule 424(b)(4) on October 27, 2021 ("Final Prospectus"). |
INFORMATICA INC. CONSOLIDATED STATEMENTS OF CASH FLOWS (in thousands) (unaudited) |
||||||||||||||||
|
|
Three Months Ended |
|
Twelve Months Ended |
||||||||||||
|
|
2022 |
|
2021 |
|
2022 |
|
2021 |
||||||||
|
|
|
|
|||||||||||||
Operating activities: |
|
|
|
|
|
|
|
|
||||||||
Net loss |
|
$ |
(4,381 |
) |
|
$ |
(66,332 |
) |
|
$ |
(53,675 |
) |
|
$ |
(99,929 |
) |
Adjustments to reconcile net loss to net cash provided by operating activities: |
|
|
|
|
|
|
|
|
||||||||
Depreciation and amortization |
|
|
4,747 |
|
|
|
6,179 |
|
|
|
21,208 |
|
|
|
24,942 |
|
Non-cash operating lease costs |
|
|
3,427 |
|
|
|
3,344 |
|
|
|
16,268 |
|
|
|
15,329 |
|
Stock-based compensation |
|
|
37,874 |
|
|
|
35,099 |
|
|
|
135,862 |
|
|
|
45,017 |
|
Deferred income taxes |
|
|
(793 |
) |
|
|
17,009 |
|
|
|
(85,579 |
) |
|
|
(18,929 |
) |
Amortization of intangible assets and acquired technology |
|
|
46,698 |
|
|
|
60,964 |
|
|
|
188,825 |
|
|
|
245,895 |
|
Amortization of debt issuance costs |
|
|
872 |
|
|
|
1,114 |
|
|
|
3,607 |
|
|
|
5,380 |
|
Amortization of investment discount, net of premium |
|
|
(722 |
) |
|
|
— |
|
|
|
(1,002 |
) |
|
|
— |
|
Loss on debt refinancing |
|
|
— |
|
|
|
30,882 |
|
|
|
— |
|
|
|
30,882 |
|
Unrealized loss (gain) on remeasurement of debt |
|
|
— |
|
|
|
1,609 |
|
|
|
— |
|
|
|
(29,711 |
) |
Changes in operating assets and liabilities: |
|
|
|
|
|
|
|
|
||||||||
Accounts receivable |
|
|
(191,965 |
) |
|
|
(174,080 |
) |
|
|
(17,249 |
) |
|
|
(26,350 |
) |
Prepaid expenses and other assets |
|
|
(35,852 |
) |
|
|
(44,205 |
) |
|
|
(25,511 |
) |
|
|
(64,177 |
) |
Accounts payable and accrued liabilities |
|
|
62,095 |
|
|
|
102,188 |
|
|
|
(50,697 |
) |
|
|
36,799 |
|
Income taxes payable |
|
|
(10,464 |
) |
|
|
(22,191 |
) |
|
|
12,127 |
|
|
|
(19,766 |
) |
Contract liabilities |
|
|
149,174 |
|
|
|
134,710 |
|
|
|
55,873 |
|
|
|
83,301 |
|
Net cash provided by operating activities |
|
|
60,710 |
|
|
|
86,290 |
|
|
|
200,057 |
|
|
|
228,683 |
|
Investing activities: |
|
|
|
|
|
|
|
|
||||||||
Purchases of property and equipment |
|
|
(3,892 |
) |
|
|
(4,802 |
) |
|
|
(5,465 |
) |
|
|
(10,817 |
) |
Purchases of investments |
|
|
(108,795 |
) |
|
|
(26,243 |
) |
|
|
(290,040 |
) |
|
|
(90,357 |
) |
Maturities of investments |
|
|
41,960 |
|
|
|
20,997 |
|
|
|
109,548 |
|
|
|
68,761 |
|
Net cash used in investing activities |
|
|
(70,727 |
) |
|
|
(10,048 |
) |
|
|
(185,957 |
) |
|
|
(32,413 |
) |
Financing activities: |
|
|
|
|
|
|
|
|
||||||||
Proceeds from issuance of common stock upon initial public offering, net of underwriting discounts and offering costs |
|
|
— |
|
|
|
905,852 |
|
|
|
— |
|
|
|
905,852 |
|
Proceeds from issuance of common stock under employee stock purchase plan |
|
|
— |
|
|
|
— |
|
|
|
32,790 |
|
|
|
— |
|
Payments of offering costs |
|
|
— |
|
|
|
— |
|
|
|
(2,085 |
) |
|
|
— |
|
Payments for dividends related to Class B-2 shares |
|
|
— |
|
|
|
— |
|
|
|
(24 |
) |
|
|
— |
|
Payments for share repurchases |
|
|
— |
|
|
|
— |
|
|
|
— |
|
|
|
(9,318 |
) |
Payment of debt |
|
|
(4,687 |
) |
|
|
(1,355,826 |
) |
|
|
(14,063 |
) |
|
|
(1,373,592 |
) |
Payment of debt issuance costs |
|
|
— |
|
|
|
(25,545 |
) |
|
|
— |
|
|
|
(25,545 |
) |
Proceeds from issuance of debt |
|
|
— |
|
|
|
441,318 |
|
|
|
— |
|
|
|
441,318 |
|
Payments for taxes related to net share settlement of equity awards |
|
|
— |
|
|
|
(1,328 |
) |
|
|
— |
|
|
|
(2,825 |
) |
Payment of deferred and contingent consideration |
|
|
— |
|
|
|
— |
|
|
|
— |
|
|
|
(10,705 |
) |
Net activity from derivatives with an other-than-insignificant financing element |
|
|
7,087 |
|
|
|
(4,816 |
) |
|
|
2,236 |
|
|
|
(18,978 |
) |
Proceeds from issuance of shares |
|
|
2,410 |
|
|
|
651 |
|
|
|
19,947 |
|
|
|
7,426 |
|
Net cash provided by / (used in) financing activities |
|
|
4,810 |
|
|
|
(39,694 |
) |
|
|
38,801 |
|
|
|
(86,367 |
) |
Effect of foreign exchange rate changes on cash, cash equivalents, and restricted cash |
|
|
3,223 |
|
|
|
2,862 |
|
|
|
(13,118 |
) |
|
|
(28 |
) |
Net (decrease) / increase in cash, cash equivalents, and restricted cash |
|
|
(1,984 |
) |
|
|
39,410 |
|
|
|
39,783 |
|
|
|
109,875 |
|
Cash, cash equivalents, and restricted cash at beginning of period |
|
|
499,863 |
|
|
|
418,686 |
|
|
|
458,096 |
|
|
|
348,221 |
|
Cash, cash equivalents, and restricted cash at end of period |
|
$ |
497,879 |
|
|
$ |
458,096 |
|
|
$ |
497,879 |
|
|
$ |
458,096 |
|
Supplemental disclosures: |
|
|
|
|
|
|
|
|
||||||||
Cash paid for interest |
|
$ |
30,329 |
|
|
$ |
18,332 |
|
|
$ |
84,563 |
|
|
$ |
103,243 |
|
Cash paid for income taxes, net of refunds |
|
$ |
19,978 |
|
|
$ |
16,057 |
|
|
$ |
92,930 |
|
|
$ |
65,260 |
|
INFORMATICA INC. NON-GAAP FINANCIAL MEASURES AND KEY BUSINESS METRICS (in thousands, except per share data) (unaudited) |
||||||||||||||||
RECONCILIATIONS OF GAAP TO NON-GAAP |
||||||||||||||||
Reconciliation of GAAP net loss to Non-GAAP net income |
||||||||||||||||
|
Three Months Ended December 31, |
|
Twelve Months Ended December 31, |
|||||||||||||
|
2022 |
|
2021 |
|
2022 |
|
2021 |
|||||||||
|
(in thousands) |
|
(in thousands) |
|||||||||||||
GAAP net loss |
$ |
(4,381 |
) |
|
$ |
(66,332 |
) |
|
$ |
(53,675 |
) |
|
$ |
(99,929 |
) |
|
Stock-based compensation |
|
37,874 |
|
|
|
35,099 |
|
|
|
135,862 |
|
|
|
45,017 |
|
|
Amortization of intangibles |
|
46,698 |
|
|
|
60,964 |
|
|
|
188,825 |
|
|
|
245,895 |
|
|
Equity compensation |
|
185 |
|
|
|
67 |
|
|
|
332 |
|
|
|
(10 |
) |
|
Restructuring, acquisition and other charges |
|
— |
|
|
|
— |
|
|
|
— |
|
|
|
128 |
|
|
Loss on debt refinancing |
|
— |
|
|
|
30,882 |
|
|
|
— |
|
|
|
30,882 |
|
|
Executive severance |
|
33 |
|
|
|
66 |
|
|
|
132 |
|
|
|
2,354 |
|
|
Sponsor-related costs |
|
— |
|
|
|
144 |
|
|
|
— |
|
|
|
1,644 |
|
|
Income tax effect |
|
(11,779 |
) |
|
|
(6,878 |
) |
|
|
(47,441 |
) |
|
|
(30,965 |
) |
|
Non-GAAP net income |
$ |
68,630 |
|
|
$ |
54,012 |
|
|
$ |
224,035 |
|
|
$ |
195,016 |
|
|
|
|
|
|
|
|
|
|
|||||||||
Net loss per share: |
|
|
|
|
|
|
|
|||||||||
Net loss per share—basic |
$ |
(0.02 |
) |
|
$ |
(0.25 |
) |
|
$ |
(0.19 |
) |
|
$ |
(0.40 |
) |
|
Net loss per share—diluted |
$ |
(0.02 |
) |
|
$ |
(0.25 |
) |
|
$ |
(0.19 |
) |
|
$ |
(0.40 |
) |
|
Non-GAAP net income per share—basic |
$ |
0.24 |
|
|
$ |
0.20 |
|
|
$ |
0.80 |
|
|
$ |
0.78 |
|
|
Non-GAAP net income per share—diluted |
$ |
0.24 |
|
|
$ |
0.20 |
|
|
$ |
0.78 |
|
|
$ |
0.76 |
|
|
|
|
|
|
|
|
|
|
|||||||||
Share count (in thousands): |
|
|
|
|
|
|
|
|||||||||
Weighted-average shares used in computing Net loss per share—basic |
|
283,410 |
|
|
|
267,473 |
|
|
|
281,129 |
|
|
|
250,418 |
|
|
Weighted-average shares used in computing Net loss per share—diluted |
|
283,410 |
|
|
|
267,473 |
|
|
|
281,129 |
|
|
|
250,418 |
|
|
Weighted-average shares used in computing Non-GAAP net income per share—basic |
|
283,410 |
|
|
|
267,473 |
|
|
|
281,129 |
|
|
|
250,418 |
|
|
Weighted-average shares used in computing Non-GAAP net income per share—diluted |
|
287,009 |
|
|
|
275,401 |
|
|
|
285,682 |
|
|
|
255,700 |
|
|
Reconciliation of GAAP income (loss) from operations to Non-GAAP income from operations |
||||||||||||||
|
Three Months Ended December 31, |
|
Twelve Months Ended December 31, |
|||||||||||
|
2022 |
|
2021 |
|
2022 |
|
2021 |
|||||||
|
(in thousands) |
|
(in thousands) |
|||||||||||
GAAP income (loss) from operations |
$ |
28,898 |
|
$ |
(1,197 |
) |
|
$ |
25,603 |
|
$ |
59,906 |
|
|
Stock-based compensation |
|
37,874 |
|
|
35,099 |
|
|
|
135,862 |
|
|
45,017 |
|
|
Amortization of intangibles |
|
46,698 |
|
|
60,964 |
|
|
|
188,825 |
|
|
245,895 |
|
|
Equity compensation |
|
185 |
|
|
67 |
|
|
|
332 |
|
|
(10 |
) |
|
Restructuring, acquisition and other charges |
|
— |
|
|
— |
|
|
|
— |
|
|
128 |
|
|
Sponsor-related costs |
|
— |
|
|
144 |
|
|
|
— |
|
|
1,644 |
|
|
Non-GAAP income from operations |
$ |
113,655 |
|
$ |
95,077 |
|
|
$ |
350,622 |
|
$ |
352,580 |
|
|
INFORMATICA INC. NON-GAAP FINANCIAL MEASURES AND KEY BUSINESS METRICS |
||||||||||||||||
Adjusted EBITDA Reconciliation |
||||||||||||||||
|
Three Months Ended |
|
Twelve Months Ended |
|||||||||||||
|
2022 |
|
2021 |
|
2022 |
|
2021 |
|||||||||
|
(in thousands) |
|
(in thousands) |
|||||||||||||
GAAP net loss |
$ |
(4,381 |
) |
|
$ |
(66,332 |
) |
|
$ |
(53,675 |
) |
|
$ |
(99,929 |
) |
|
Income tax expense |
|
8,721 |
|
|
|
8,356 |
|
|
|
19,478 |
|
|
|
24,039 |
|
|
Interest income |
|
(4,916 |
) |
|
|
(368 |
) |
|
|
(9,224 |
) |
|
|
(1,213 |
) |
|
Interest expense |
|
26,450 |
|
|
|
23,833 |
|
|
|
78,020 |
|
|
|
132,439 |
|
|
Loss on debt refinancing |
|
— |
|
|
|
30,882 |
|
|
|
— |
|
|
|
30,882 |
|
|
Other income (expense), net |
|
3,024 |
|
|
|
2,432 |
|
|
|
(8,996 |
) |
|
|
(26,312 |
) |
|
Stock-based compensation |
|
37,874 |
|
|
|
35,099 |
|
|
|
135,862 |
|
|
|
45,017 |
|
|
Amortization of intangibles |
|
46,698 |
|
|
|
60,964 |
|
|
|
188,825 |
|
|
|
245,895 |
|
|
Equity compensation |
|
185 |
|
|
|
67 |
|
|
|
332 |
|
|
|
(10 |
) |
|
Restructuring, acquisition and other charges |
|
— |
|
|
|
— |
|
|
|
— |
|
|
|
128 |
|
|
Sponsor-related costs |
|
— |
|
|
|
144 |
|
|
|
— |
|
|
|
1,644 |
|
|
Depreciation |
|
4,721 |
|
|
|
6,139 |
|
|
|
21,007 |
|
|
|
24,839 |
|
|
Adjusted EBITDA |
$ |
118,376 |
|
|
$ |
101,216 |
|
|
$ |
371,629 |
|
|
$ |
377,419 |
|
|
Unlevered Free Cash Flows |
||||||||||||||||
|
Three Months Ended December 31, |
|
Twelve Months Ended December 31, |
|||||||||||||
|
2022 |
|
2021 |
|
2022 |
|
2021 |
|||||||||
|
(in thousands, except percentages) |
|
(in thousands, except percentages) |
|||||||||||||
Total GAAP Revenue |
$ |
398,781 |
|
|
$ |
406,710 |
|
|
$ |
1,505,118 |
|
|
$ |
1,444,055 |
|
|
Net cash provided by operating activities |
$ |
60,710 |
|
|
$ |
86,290 |
|
|
$ |
200,057 |
|
|
$ |
228,683 |
|
|
Less: Purchases of property, plant, and equipment |
|
(3,892 |
) |
|
|
(4,802 |
) |
|
|
(5,465 |
) |
|
|
(10,817 |
) |
|
Add: Cash paid for interest |
|
30,329 |
|
|
|
18,332 |
|
|
|
84,563 |
|
|
|
103,243 |
|
|
Add: Equity compensation payments |
|
134 |
|
|
|
210 |
|
|
|
638 |
|
|
|
1,196 |
|
|
Add: Executive severance |
|
4,050 |
|
|
|
4,050 |
|
|
|
7,969 |
|
|
|
4,628 |
|
|
Add: Restructuring costs |
|
178 |
|
|
|
246 |
|
|
|
753 |
|
|
|
3,579 |
|
|
Add: Sponsor management fees |
|
— |
|
|
|
144 |
|
|
|
— |
|
|
|
1,644 |
|
|
Unlevered Free Cash Flows (after-tax)(1) |
$ |
91,509 |
|
|
$ |
104,470 |
|
|
$ |
288,515 |
|
|
$ |
332,156 |
|
|
Unlevered Free Cash Flows (after-tax) margin(1) |
|
23 |
% |
|
|
26 |
% |
|
|
19 |
% |
|
|
23 |
% |
|
(1) Includes cash tax payments of $20.0 million and $16.0 million for the three months ended December 31, 2022 and 2021, respectively, and cash tax payments of $92.9 million and $65.2 million for the year ended December 31, 2022 and 2021, respectively. |
Key Business Metrics |
||||||||
| The following are our key business metrics as of December 31, 2022 and 2021. | ||||||||
|
December 31, |
|||||||
|
2022 |
|
2021 |
|||||
|
(in thousands, except percentages) |
|||||||
Total Annual Recurring Revenue |
$ |
1,517,060 |
|
|
$ |
1,360,237 |
|
|
Maintenance Annual Recurring Revenue |
$ |
522,837 |
|
|
$ |
557,908 |
|
|
Subscription Annual Recurring Revenue |
$ |
994,223 |
|
|
$ |
802,329 |
|
|
Cloud Annual Recurring Revenue |
$ |
451,188 |
|
|
$ |
316,994 |
|
|
Subscription Net Retention Rate |
|
111 |
% |
|
|
114 |
% |
|
INFORMATICA INC. SUPPLEMENTAL INFORMATION |
||||||
| Additional Business Metrics | ||||||
|
December 31, |
|||||
|
2022 |
|
2021 |
|||
Maintenance Renewal Rate |
96 |
% |
|
95 |
% |
|
Subscription Renewal Rate |
94 |
% |
|
92 |
% |
|
Customers that spend more than $1 million in Subscription Annual Recurring Revenue (1) |
206 |
|
|
153 |
|
|
Customers that spend more than $100,000 in Subscription Annual Recurring Revenue (2) |
1,916 |
|
|
1,660 |
|
|
Cloud transactions processed per month in trillions (3) |
53.0 |
|
|
27.8 |
|
|
| (1) Total number of customers that spend more than $1 million in Subscription Annual Recurring Revenue. | ||||||
(2) Total number of customers that spend more than $100,000 in Subscription Annual Recurring Revenue. |
||||||
(3) Total number of cloud transactions processed on our platform per month in trillions, which measures data processed. |
Net Debt Reconciliation |
||||||||
|
December 31, |
|||||||
|
2022 |
|
2021 |
|||||
|
(in millions) |
|||||||
Dollar Term Loan |
$ |
1,861 |
|
|
$ |
1,875 |
|
|
Less: Cash, cash equivalents, and short-term investments |
|
(716 |
) |
|
|
(496 |
) |
|
Add: Corporate debt securities(1) |
|
22 |
|
|
|
— |
|
|
Add: Non-U.S. government securities(1) |
|
4 |
|
|
|
— |
|
|
Total net debt |
$ |
1,171 |
|
|
$ |
1,379 |
|
|
(1) Adjusted from total net debt for the purpose of calculating Total Net First Lien Leverage ratio as defined in the Credit and Guaranty Agreement. |


