Table of Contents
What Is Data Wrangling?
Why Is Data Wrangling Important?
The 6 Steps of Data Wrangling
What Are Common Data Wrangling Tools?
When Is Data Wrangling Used?
What Are the Challenges with Data Wrangling?
Features of Successful Data Wrangling Solutions
Common Use Cases of Data Wrangling
Next Steps
What Is Data Wrangling?
Data wrangling — also called data blending or data munging — is the process of removing errors from raw data. This prepares it for use and analysis. Due to the amount of data and data sources available today (around 2.5 quintillion bytes worth of data are generated each day1), compiling and organizing large quantities of data for analysis is a must.
Data wrangling helps organizations to assemble more complex data in less time to produce actionable insights. The methods vary from subject and technical expertise depending on your data and your goals. More and more organizations are relying on data wrangling tools to accelerate downstream analytics.
Data wrangling can be a manual or automated process, depending on the user’s skillset. When datasets are very large and spread across multiple data lakes and ecosystems, simplified data convergence is a necessity to quickly act. In organizations that employ a full data team, a data scientist, engineer or other team members are typically responsible for bringing all the data together. In smaller organizations, non-data professionals are often responsible for quickly compiling their data across disparate data sources before it’s usable.
Why Is Data Wrangling Important?
Data wrangling ensures data is in a reliable state before it is used and analyzed. If data is non-standardized or unreliable, then analyses will be too. Any query will return incomplete and incorrect sets of data. This would produce invalid outcomes when analyzed.
The 6 Steps of Data Wrangling
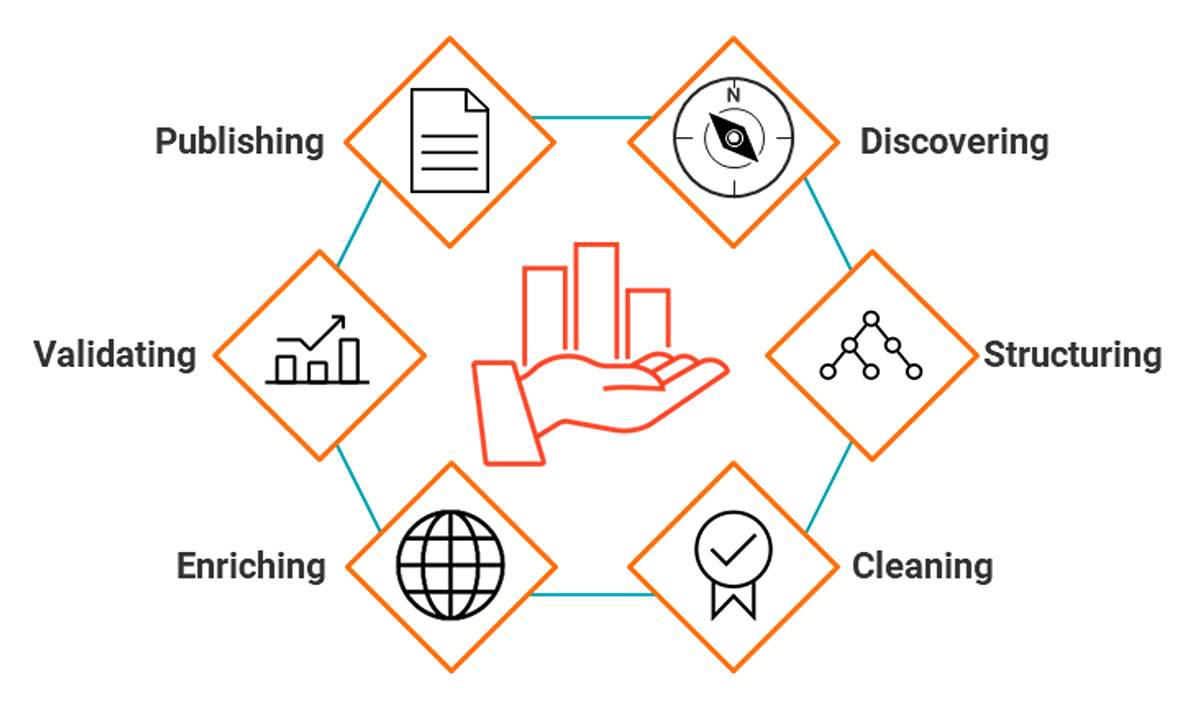
There are six steps that make up the data wrangling process. It is an iterative process that should produce a clean and usable data set that can then be used for analysis. This process is tedious but rewarding. It allows analysts to get the information they need out of a large set of data that would otherwise be unreadable:
- Discovering: This is the first step to familiarize yourself with your data and get a better feel for how you will use it. To get familiar with the data, you must have the appropriate context to easily consume and analyze it. Data definitions, lineages, business rules, samples, types and domains all help accelerate the end users’ understanding and ability to act quickly on the data.
- Structuring: A lot of the raw data may not be useful. To cleanse and join massive data sets (hundreds of thousands of rows), standardizing and conforming capabilities are required to simplify and consolidate future steps. This includes formatting in a standard way, as well as organizing fields for quick analysis (i.e., qualitative verses quantitative values).
- Cleaning: This step ensures the completeness of the data through profiling results to identify patterns in the data, along with errors, such as missing or incomplete values, that need to be addressed. What you do in this phase informs every activity that comes afterward. Other examples are removing outliers that will skew results and formatting null values.
- Enriching: During this step, data analysts will determine whether adding data sets would benefit their analysis. For example, adding new fields, aggregating existing ones, or bringing lookup tables to translate technical jargon to business terminology.
- Validating: This step refers to the process of verifying that your data is both consistent and of high quality. Data validation is typically done by checking whether the datasets are accurate against the source and if attributes are normally distributed.
- Publishing: When the data is fit for use, it can be shared and easily accessed by the appropriate data consumers to take actionable insights, build upon initial goals and identify additional opportunities to collaborate upon.
What Are Common Data Wrangling Tools?
There are several data wrangling tools that can be used for gathering, importing, structuring and cleaning data before it is used in analysis. Software or automated tools for data wrangling allow you to validate data mappings and review data samples at every step of the transformation process. This helps to identify and correct errors in data mapping. For manual data cleaning processes, the data team or data scientist handles data wrangling.
Some examples of basic data wrangling tools are:
- Spreadsheets (Excel, etc.): The most basic manual data wrangling tool
- Tableau, Qlik: Business intelligence (BI) tools that can compile data
- Ecosystems (Google Cloud, Microsoft Azure, Amazon Web Services): Cloud platform vendors include basic data wrangling solutions to speed up data storage in their cloud repositories
- Talend, Paxata, Alteryx: Data services that explore and prepare data
When Is Data Wrangling Used?
Data wrangling is used to:
- Save preparation steps and apply to similar datasets
- Detect anomalies, outliers and duplicates
- Preview and provide feedback
- Normalize, standardize and enrich data
- Pivot and reshape data
- Aggregate data
- Combine data across multiple sources through joins/unions
- Schedule a process to run on a time-based or trigger-based event
Organizations may also use data wrangling tools for data enablement. This will reduce the time and complexity of accessing, harmonizing, transforming and modelling data for analytics in an agile manner.
What Are the Challenges with Data Wrangling?
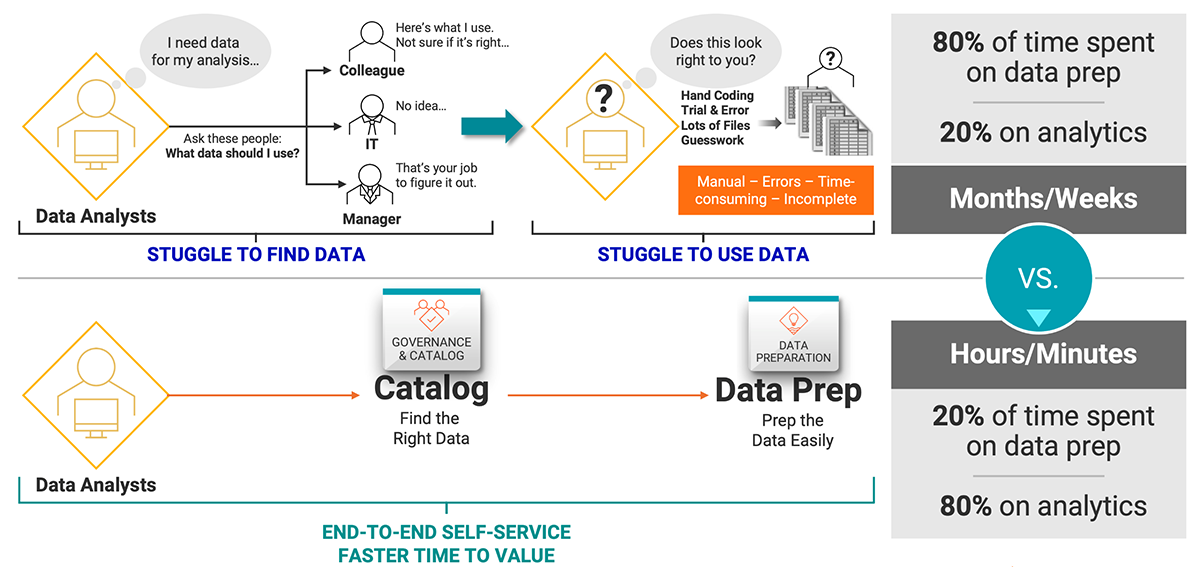
Data wrangling can be time-consuming, complex and resource-intensive, particularly when done manually. To avoid this, many organizations have best practices that help streamline the data compilation process.
Many hand coding capabilities (like Python) exist that can help streamline the wrangling process for common problems (like standardizing date formats). But there will always be issues that require human intervention and interpretation. Only a real person can understand the meaning of a non-standard format and change it into standard syntax that software can organize.
Features of Successful Data Wrangling Solutions
Successful data wrangling solutions have the following features:
- Core Data Preparation
- Ability to integrate with shared services (like data integration, data quality, data catalog and data marketplace)
- Advanced capabilities to transform, standardize and enrich by creating codeless data wrangling “recipes” for enterprise data transparency
- Self-Service and Collaboration
- Find and preview data assets in a shared catalog
- See and share peer data asset creations
- Enterprise Focus
- Understand data lineage and relationships
- Easy to use and familiar Excel-like interface to transform and enrich your data assets
Informatica provides data consumers the ability to wrangle all their data in a code-free environment, leveraging metadata-driven development to simplify time to insight for business users.
Common Use Cases of Data Wrangling
Data wrangling is used across many industries. Below are some examples.
- Banking: Helps financial institutions access, manage and govern high quality data to measure, manage and monitor risk for ongoing credit, market and operational risk management needs.
- Healthcare: Helps healthcare and pharma companies speed research and development, accelerate drug discovery and deliver breakthrough therapies faster.
- Insurance: Supports use cases like risk management and underwriting.
- Manufacturing: Helps drive various use cases such as supply chain optimization, asset management and operational intelligence.
- Public sector: Supports use cases like cybersecurity, improving citizen experience and case management.
Next Steps
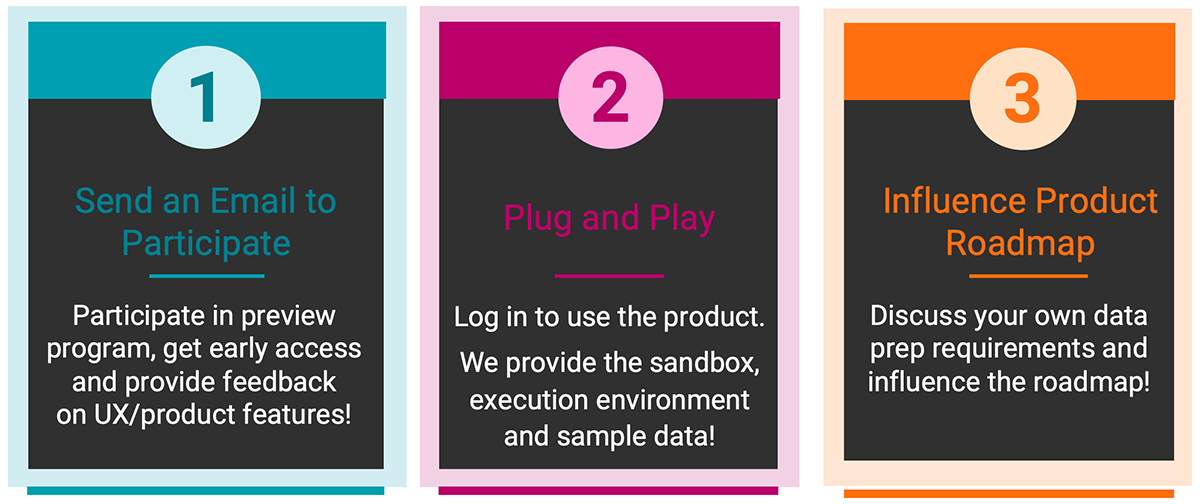
Interested in learning more? Get early access to the newest Informatica Intelligent Data Management Cloud™ (IDMC) capability. To participate in our data wrangling preview program, email dataprep.preview@informatica.com.

Three steps to data wrangling with IDMC


