Informatica Reports Third Quarter 2025 Financial Results
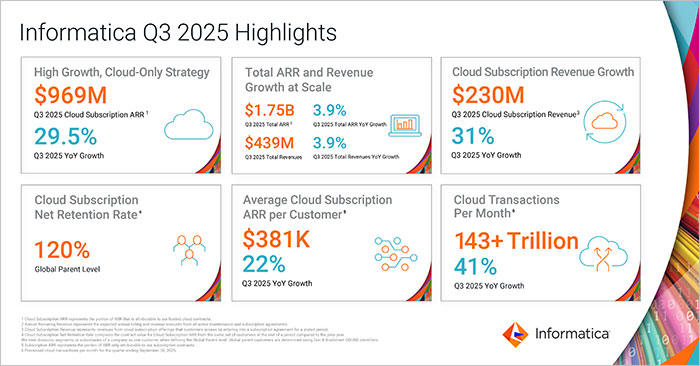
- Cloud Subscription Annualized Recurring Revenue (ARR) increased to $969 million, representing 29.5% year-over-year growth, 29.4% in constant currency
- Total ARR increased to $1.75 billion, representing 3.9% year-over-year growth, 3.8% in constant currency
REDWOOD CITY, CA, November 5, 2025 — Informatica (NYSE: INFA), a leader in enterprise AI-powered cloud data management, today announced financial results for its third quarter 2025, ended September 30, 2025.
"We delivered another strong quarter with 29.5% year-over-year growth in Cloud Subscription ARR, driven by demand for our AI-powered IDMC platform. Customers continue to choose Informatica to scale their agentic AI initiatives and solve complex business challenges by building on IDMC powered for CLAIRE AI — empowering them to connect trusted, AI-ready data with seamless integration across platforms, enabling faster innovation, smarter operations, and the development of AI systems,” said Amit Walia, Chief Executive Officer at Informatica. “We continued working toward closing the transaction with Salesforce."
Third Quarter 2025 Financial Highlights:
- GAAP Total Revenues increased to $439.2 million, representing 3.9% year-over-year growth or 2.2% year-over-year growth on a constant currency basis(1). Total revenues included a positive impact of approximately $7.4 million from foreign currency exchange rates (FX) year-over-year.
- GAAP Cloud Subscription Revenue increased to $230.4 million, representing 31.0% year-over-year growth, and represented 71.9% of subscription revenue.
- Total ARR increased to $1.75 billion, representing 3.9% year-over-year growth or 3.8% year-over-year growth on a constant currency basis. Total ARR included a positive impact of approximately $2.2 million from FX rates year-over-year.
- Cloud Subscription ARR increased to $968.6 million, representing 29.5% year-over-year growth or 29.4% year-over-year growth on a constant currency basis. Cloud Subscription ARR included a positive impact of approximately $0.7 million from FX rates year-over-year.
- GAAP Operating Income of $60.9 million and Non-GAAP Operating Income of $161.4 million. GAAP Operating Margin of 13.9% and Non-GAAP Operating Margin of 36.8%.
- GAAP Operating Cash Flow of $148.7 million.
- Adjusted Unlevered Free Cash Flow (after-tax) of $180.8 million. Cash paid for interest of $30.5 million.
A reconciliation of GAAP to non-GAAP financial measures has been provided in the tables included in this press release. An explanation of these measures is also included below under the heading “Non-GAAP Financial Measures.”
Third Quarter 2025 Business Highlights:
- Processed 143.3 trillion cloud transactions per month for the quarter ended September 30, 2025, as compared to 101.3 trillion cloud transactions per month in the same quarter last year, an increase of 41% year-over-year.
- Achieved a Cloud Subscription Net Retention Rate (NRR) of 120% at the global parent level as of September 30, 2025.
- Reported 2,545 Cloud Subscription ARR customers at the end of September 30, 2025, an increase of 6% year-over-year.
Product Innovation:
- Launched the first CLAIRE® Agents that empower users to automate complex data management goals:
- CLAIRE® Data Exploration Agents enable complex natural language queries on Master Data Management (MDM) and enterprise data using natural language;
- CLAIRE® Enterprise Discovery Agents provide contextual and accurate results from an organization’s data sources to quickly deliver relevant, accurate and personalized data for AI and analytics;
- CLAIRE® ELT Agents empower business users to build data pipelines and better collaborate with data engineers to deploy them;
- CLAIRE® Product Help Agents provide context-aware responses to questions pertaining to data within Informatica’s Intelligent Data Management Cloud (IDMC);
- CLAIRE® Data Quality Agents (Public Preview) let users create, evaluate and operationalize data quality rules in minutes based on business specifications in natural language; and
- CLAIRE® Product Experience Agents (Private Preview) help classify products and enrich product records within MDM records with both structured and unstructured data.
- Announced new capabilities in CLAIRE® GPT, including planning, advanced reasoning and improved natural language understanding, helping users plan, automate and optimize data workflows through natural language interactions. CLAIRE GPT's compound reasoning and execution system uses Azure OpenAI and AWS Bedrock Claude models within Informatica's secure cloud environment to deliver enterprise-grade agentic data management.
- Launched CLAIRE® Copilot for MDM to simplify master data usage and understanding through natural language queries to explore master data and access product help seamlessly from within Informatica MDM.
- Announced new capabilities in CLAIRE® Copilot for Data Integration to create data pipelines with an NLP-driven guided experience and the ability to ask questions with answers sourced directly from documentation and help articles.
- Launched AI-powered Lineage Discovery powered by CLAIRE® to map data flows from source systems to applications and AI models, accelerating speed of Cloud Data Governance and Catalog (CDGC) deployment, time-to-insights and modernization efforts.
- Launched AI Governance and Inventory Workflows, a robust AI governance catalog for AI use cases tracking models, datasets, and approvals, ensuring responsible and compliant deployment across the enterprise. This includes the ability to customize evaluation metrics, scanning and visualizing lineage for AI models, and a workflow builder in CDGC that manages approvals for AI models, supporting better stakeholder collaboration.
- Launched AI Agent Engineering (Private Preview) enabling enterprises to build, connect, orchestrate and manage customizable Informatica agents through a no-code interface, reducing AI agent development time. With built-in test consoles for validation, advanced monitoring, full SDLC support, logging and observability, customers can build, test, deploy, monitor and govern AI agents at scale.
- Launched AI Agent Hub (Private Preview) offering pre-built, domain-specific AI agents and automation recipes that dramatically reduce setup time. These include integrations across Jira, Salesforce, Dynamics, Snowflake and Microsoft Teams, alongside support for specialized lead management, approval workflows and MDM data discovery.
- Launched Unstructured Data Governance (Private Preview) enabling CDGC users to scan, classify and catalog unstructured data files with classification based on hierarchical taxonomies, allowing enterprises to curate content for GenAI use cases within their data catalog.
- Launched Agentic Product Information Management (PIM) for Product 360 and Agentforce Extension: new Agentic PIM for Product 360 (private preview) simplifies product data stewardship through intuitive conversational experiences. The MDM Extension for Agentforce connects Salesforce-native AI agents with unified, governed master data - bringing trusted, context-rich data and insights directly into customer engagement workflows.
- Enhanced Open Table Iceberg for Data Lakehouse architecture: enterprises can use Databricks' scalable data lakehouse architecture by connecting and managing data stored in its Databricks-managed Iceberg tables. Enterprises can also maintain efficient, scalable, and reliable data pipelines with Iceberg BigLake tables in Google BigQuery data integration workflows, or leverage AWS SageMaker Lakehouse's modern architecture to access Iceberg tables on Amazon S3.
- Expanded partnership with Oracle:
- launched Blueprint for Agentic AI on Oracle Cloud Infrastructure (OCI) with no-code, pre-built connectors, recipes, and a rich API layer to speed agent development;
- announced a dedicated MCP server within Informatica's IDMC platform that accelerates deployment and reduces time-to-value for enterprise agentic AI projects starting in April 2026;
- announced availability of Informatica MDM SaaS on OCI, delivering unified, trusted data from any business domain, including customer, supplier, product, patient, and provider, with enterprise-grade security, performance, and cloud-native efficiency starting in November 2025; and
- launched support for IDMC deployments within OCI Dedicated Regions, enabling customers to run the entire IDMC platform, including MDM, data governance, and other IDMC services in a private, sovereign environment to address stringent regulatory and data-residency requirements.
Industry Recognition:
- Named "Outstanding Customer Service Experience” by J.D. Power for the fifth consecutive year in Technical Support.
- Named a Winner in the 2025 Technology & Services Industry Association (TSIA) Star Award for Excellence in Content Strategy.
- Recognized as a Leader in The Forrester Wave™: Data Governance Solutions, Q3 2025.
- Ranked #1 in Cloud Master Data Management in the 2024 Gartner® Market Share Report.
- Recognized as a Leader in the ISG Data Management 2025 Buyers Guide.
- Recognized as a Leader in the ISG Data Integration 2025 Buyers Guide.
- Recognized as a Leader in the ISG Data Governance 2025 Buyers Guide.
- Recognized as a Leader in the ISG Data Quality 2025 Buyers Guide.
- Recognized as a Leader in the ISG Data Intelligence 2025 Buyers Guide.
- Recognized as a Leader in the ISG Master Data Management 2025 Buyers Guide.
Pending Acquisition by Salesforce
In a separate press release issued on May 27, 2025, Informatica announced that it had entered into a definitive agreement, or the Merger Agreement, to be acquired by Salesforce. A copy of the press release and supplemental materials can be found on the “Investor Relations” page of our website at https://investors.informatica.com and on the Securities and Exchange Commission, or the SEC, website at http://www.sec.gov. Additional details and information about the terms and conditions of the Merger Agreement and the transactions contemplated by the Merger Agreement are available in the Current Report on Form 8-K filed with the SEC on May 28, 2025.
In light of the pending transaction with Salesforce, Informatica will not be hosting an earnings conference call to review the third quarter or providing financial guidance in conjunction with this press release. The Merger is expected to close in the fourth quarter of Salesforce's fiscal year 2026 or early in Salesforce’s fiscal year 2027, which begins on February 1, 2026, subject to the receipt of required regulatory clearances and satisfaction of other customary closing conditions set forth in the Merger Agreement. For further detail and discussion of our financial performance, please refer to our Annual Report on Form 10-K for the year ended December 31, 2024, filed with the SEC, and our Quarterly Report on Form 10-Q that will be filed for the third quarter ended September 30, 2025.
Forward-Looking Statements
This press release contains forward-looking statements within the meaning of Section 27A of the Securities Act of 1933, as amended, and Section 21E of the Securities Exchange Act of 1934, as amended. These statements may relate to, but are not limited to, statements regarding Informatica's proposed acquisition by Salesforce, management’s plans, priorities, initiatives, and strategies, the potential benefits realized by customers by the use of artificial intelligence and machine learning in our products and the potential benefits realized by customers from our cloud modernization programs, market, and partnerships. Forward-looking statements are inherently subject to risks and uncertainties, some of which cannot be predicted or quantified. In some cases, you can identify forward-looking statements because they contain words such as “anticipate,” “believe,” “contemplate,” “continue,” “could,” “estimate,” “expect,” “intend,” “may,” “plan,” “potential,” “predict,” “project,” “should,” “target,” “toward,” “will,” or “would,” or the negative of these words or other similar terms or expressions. You should not put undue reliance on any forward-looking statements. Forward-looking statements should not be read as a guarantee of future performance or results and will not necessarily be accurate indications of the times at, or by, which such performance or results will be achieved, if at all.
Forward-looking statements are based on information available at the time those statements are made and are based on current expectations, estimates, forecasts, and projections as well as the beliefs and assumptions of management as of that time with respect to future events. These statements are subject to risks and uncertainties, many of which involve factors or circumstances that are beyond our control, that could cause actual performance or results to differ materially from those expressed in or suggested by the forward-looking statements. In light of these risks and uncertainties, the forward-looking events and circumstances discussed in this press release may not occur and actual results could differ materially from those anticipated or implied in the forward-looking statements. These risks, uncertainties, assumptions, and other factors include, but are not limited to, those related to our business and financial performance, the pending acquisition by Salesforce, the effects of adverse global macroeconomic conditions and geopolitical uncertainty, including tariffs, our ability to attract and retain customers, our ability to develop new products and services and enhance existing products and services, our ability to respond rapidly to emerging technology trends, our ability to execute on our business strategy, including our strategy related to the Informatica IDMC platform and key partnerships, our ability to increase and predict customer consumption of our platform, our ability to compete effectively, and our ability to manage growth.
Further information on these and additional risks, uncertainties, and other factors that could cause actual outcomes and results to differ materially from those included in or contemplated by the forward-looking statements contained in this press release are included under the caption “Risk Factors” and elsewhere in our Annual Report on Form 10-K that was filed for the fiscal year ended December 31, 2024, and other filings and reports we make with the Securities and Exchange Commission from time to time, including our Quarterly Report on Form 10-Q that will be filed for the third quarter ended September 30, 2025. All forward-looking statements contained herein are based on information available to us as of the date hereof and we do not assume any obligation to update these statements as a result of new information or future events.
Non-GAAP Financial Measures and Key Business Metrics
We review several operating and financial metrics, including the following unaudited non-GAAP financial measures and key business metrics to evaluate our business, measure our performance, identify trends affecting our business, formulate business plans, and make strategic decisions:
Non-GAAP Financial Measures
In addition to our results determined in accordance with U.S. generally accepted accounting principles (GAAP), we believe the following non-GAAP measures are useful in evaluating our operating performance. We use the following non-GAAP financial measures to evaluate our ongoing operations and for internal planning and forecasting purposes. We believe that these non-GAAP financial measures, when taken collectively, may be helpful to investors because they provide consistency and comparability with past financial performance. However, non-GAAP financial measures are presented for supplemental informational purposes only, have limitations as an analytical tool, and should not be considered in isolation or as a substitute for financial information presented in accordance with GAAP. In addition, other companies, including companies in our industry, may calculate similarly titled non-GAAP measures differently or may use other measures to evaluate their performance, all of which could reduce the usefulness of our non-GAAP financial measures as tools for comparison. A reconciliation is provided below for our non-GAAP financial measures to the most directly comparable financial measures stated in accordance with GAAP. Investors are encouraged to review the related GAAP financial measures and the reconciliation of these non-GAAP financial measures to their most directly comparable GAAP financial measures, and not to rely on any single financial measure to evaluate our business.
Non-GAAP Income from Operations and Operating Margin and Non-GAAP Net Income exclude the effect of stock-based compensation expense-related charges, including employer payroll tax-related items on employee stock transactions, amortization of acquired intangibles, expenses associated with acquisitions, debt refinancing costs, sponsor-related costs, expenses associated with restructuring efforts, and facility impairment, and are adjusted for income tax effects. We believe the presentation of operating results that exclude these non-cash or non-recurring items provides useful supplemental information to investors and facilitates the analysis of our operating results and comparison of operating results across reporting periods.
Adjusted EBITDA represents GAAP net income (loss) as adjusted for income tax benefit (expense), interest income, interest expense, debt refinancing costs, other income (expense) net, stock-based compensation-related charges, including employer payroll tax-related items on employee stock transactions, amortization of intangibles, facility impairment, expenses associated with restructuring efforts, expenses associated with acquisitions, sponsor-related costs and depreciation. We believe adjusted EBITDA is an important metric for understanding our business to assess our relative profitability adjusted for balance sheet debt levels.
Adjusted Unlevered Free Cash Flow (after-tax) represents operating cash flow less purchases of property and equipment and is adjusted for interest payments, sponsor-related costs, expenses associated with acquisitions and restructuring costs (including payments for impaired leases). We believe this measure provides useful supplemental information to investors because it is an indicator of our liquidity over the long term needed to maintain and grow our core business operations.
Key Business Metrics
Annual Recurring Revenue ("ARR") represents the expected annual billing amounts from all active maintenance and subscription agreements. ARR is calculated based on the contract Monthly Recurring Revenue (MRR) multiplied by 12. MRR is calculated based on the accounting adjusted total contract value divided by the number of months of the agreement based on the start and end dates of each contracted line item. The aggregate ARR calculated at the end of each reported period represents the value of all contracts that are active as of the end of the period, including those contracts that have expired but are still under negotiation for renewal. We typically allow for a grace period of up to 6 months past the original contract expiration quarter during which we engage in the renewal process before we report the contract as lost/inactive. This grace-period ARR amount has been approximately 2% or less of the reported ARR in each period presented. If there is an actual cancellation of an ARR contract, we remove that ARR value at that time. We believe ARR is an important metric for understanding our business since it tracks the annualized cash value collected over a 12-month period for all of our recurring contracts, irrespective of whether it is a maintenance contract on a perpetual license, a ratable cloud contract, or a self-managed term-based subscription license. ARR should be viewed independently of total revenue and deferred revenue related to our subscription and services contracts and is not intended to be combined with or to replace either of those items.
Cloud Subscription Annual Recurring Revenue ("Cloud Subscription ARR") represents the portion of ARR that is attributable to our hosted cloud contracts. We believe that Cloud Subscription ARR is a helpful metric for understanding our business since it represents the approximate annualized cash value collected over a 12-month period for all of our recurring Cloud contracts. Cloud Subscription ARR should be viewed independently of cloud subscription revenue and deferred revenue related to our subscription contracts and is not intended to be combined with or to replace either of those items.
Self-managed Subscription Annual Recurring Revenue ("Self-Managed Subscription ARR") represents the portion of ARR that is attributable to our self-managed subscription contracts. We believe that Self-Managed Subscription ARR is a helpful metric for understanding our business since it represents the approximate annualized cash value collected over a 12-month period for all of our recurring self-managed subscription contracts. Self-Managed Subscription ARR should be viewed independently of subscription revenue and deferred revenue related to our subscription contracts and is not intended to be combined with or to replace either of those items. As we continue to shift our focus from perpetual to cloud, we expect Self-managed Subscription ARR will decrease in future quarters.
Maintenance Annual Recurring Revenue ("Maintenance ARR") represents the portion of ARR only attributable to our maintenance contracts. We believe that Maintenance ARR is a helpful metric for understanding our business since it represents the approximate annualized cash value collected over a 12-month period for all our maintenance contracts. Maintenance ARR includes maintenance contracts supporting our perpetual licenses. Maintenance ARR should be viewed independently of maintenance revenue and deferred revenue related to our maintenance contracts and is not intended to be combined with or to replace either of those items. As we continue to shift our focus from perpetual to cloud, we expect Maintenance ARR will decrease in future quarters.
Cloud Subscription Net Retention Rate ("Cloud Subscription NRR") compares the contract value for Cloud Subscription ARR from the same set of customers at the end of a period compared to the prior year. We treat divisions, segments, or subsidiaries of a company as one customer when defining the Global Parent level. Global Parent customers are determined using Dun & Bradstreet GDUNS identifiers. To calculate our Cloud Subscription NRR for a particular period, we first establish the Cloud Subscription ARR value at the end of the prior year period. We subsequently measure the Cloud Subscription ARR value at the end of the current period from the same cohort of customers. Cloud Subscription NRR is then calculated by dividing the aggregate Cloud Subscription ARR in the current period by the prior year period. An increase in the Cloud Subscription NRR occurs as a result of price increases on existing contracts, higher consumption of existing products, and sales of additional new subscription products to existing customers exceeding losses from subscription contracts due to price decreases, usage decreases and cancellations. We believe Cloud Subscription NRR is an important metric for understanding our business since it measures the rate at which we are able to sell additional products into our cloud subscription customer base.
Revenue Disaggregation
Revenue recognized over time:
- Cloud subscription revenue(i) represents revenues from cloud subscription offerings, which deliver applications and infrastructure technologies via cloud-based deployment models for which we develop functionality, provide unspecified updates and enhancements, host, manage, upgrade, and support, and that customers access by entering into a subscription agreement with us for a stated period.
- Self-managed subscription support and other revenue(i) represents revenues generated primarily through the sale of license support contracts sold together with the self-managed subscription license purchased by the customer. Self-managed subscription license support contracts provide customers with rights to unspecified software product upgrades, maintenance releases and patches released during the term of the support period and include internet access to technical content, as well as internet and telephone access to technical support personnel.
- Maintenance revenue(ii) represents revenues from fees for ongoing support and product updates mainly for our previously sold perpetual licenses.
Revenue recognized at a point in time:
- Self-managed subscription license revenue(i)(iii) represents revenues from customers and partners for the license rights to our on-premise self-managed software during a subscription term. When customers enter into a new subscription contract or renew an existing contract, this revenue is recognized upon the later of when the software license is made available to the customer or the subscription term commences.
Revenue recognized as services are provided:
- Professional services revenue(ii) represents revenues from non-recurring fees associated with implementation, education, and consulting services related to our software products.
(i) Included in Subscription revenue on the consolidated statements of operations.
(ii) Included in Maintenance and Professional services revenue on the consolidated statements of operations.
(iii) The Company previously presented Perpetual license revenues separately. Because revenues for perpetual licenses are not material for current or past periods due to our transition to a cloud-only, consumption-driven strategy, the Company has combined these amounts into Self-managed subscription license recognized at a point in time and retrospectively adjusted past periods for comparative purposes.
Forrester, The Forrester Wave™: Data Governance Solutions, Q3 2025, by Raluca Alexandru, 9 July 2025 was published by Forrester. Forrester does not endorse any company, product, brand, or service included in its research publications and does not advise any person to select the products or services of any company or brand based on the ratings included in such publications. Information is based on the best available resources. Opinions reflect judgment at the time and are subject to change.
Gartner Market Share: Enterprise Software, Worldwide 2024, by Varsha Mehta, et al., 17 April 2025 was published by Gartner, Inc. GARTNER is a registered trademark and service mark of Gartner, Inc. and/or its affiliates in the U.S. and internationally and is used herein with permission, and the objectivity disclaimer given above. Gartner does not endorse any vendor, product or service depicted in its research publications, and does not advise technology users to select only those vendors with the highest ratings or other designation. Gartner research publications consist of the opinions of Gartner's research organization and should not be construed as statements of fact. Gartner disclaims all warranties, expressed or implied, with respect to this research, including any warranties of merchantability or fitness for a particular purpose.
(1) Constant currency basis is calculated by translating current period revenue using the comparable period's exchange rates from the prior year.
About Informatica
Informatica (NYSE: INFA), a leader in AI-powered enterprise cloud data management, helps businesses unlock the full value of their data and AI. As data grows in complexity and volume, Informatica’s Intelligent Data Management Cloud™ delivers a complete, end-to-end platform with a suite of industry-leading, integrated solutions to connect, manage and unify data across any cloud, hybrid or multi-cloud environment. Powered by CLAIRE® AI, Informatica’s platform integrates natively with all major cloud providers, data warehouses and analytics tools— giving organizations the freedom of choice, avoiding vendor lock-in and delivering better ROI by enabling access to governed data, simplifying operations and scaling with confidence.
Trusted by approximately 5,000 customers in nearly 100 countries—including over 80 of the Fortune 100—Informatica is the backbone of platform-agnostic, cloud data-driven transformation. Informatica. Where data and AI come to life.™
###
Contacts:
Investor Relations:
Victoria Hyde-Dunn
vhydedunn@informatica.com
Public Relations:
pr@informatica.com
≈
INFORMATICA INC.
CONSOLIDATED STATEMENTS OF OPERATIONS
(in thousands, except per share data)
(unaudited)
| Three Months Ended June 30, |
| Six Months Ended June 30, | ||||
| 2025 |
| 2024 |
| 2025 |
| 2024 |
|
|
|
|
|
|
|
|
Revenues: |
|
|
|
|
|
|
|
Subscription revenue | $ 287,034 |
| $ 264,306 |
| $ 571,044 |
| $ 516,304 |
Maintenance and professional services | 120,310 |
| 136,319 |
| 240,197 |
| 272,928 |
Total revenues | 407,344 |
| 400,625 |
| 811,241 |
| 789,232 |
Cost of revenues: |
|
|
|
|
|
|
|
Subscription costs | 53,606 |
| 47,367 |
| 107,351 |
| 94,210 |
Maintenance and professional services costs | 27,171 |
| 34,501 |
| 53,907 |
| 68,379 |
Amortization of acquired technology | 538 |
| 1,027 |
| 1,069 |
| 2,061 |
Total cost of revenues | 81,315 |
| 82,895 |
| 162,327 |
| 164,650 |
Gross profit | 326,029 |
| 317,730 |
| 648,914 |
| 624,582 |
Operating expenses: |
|
|
|
|
|
|
|
Research and development | 88,240 |
| 79,234 |
| 170,213 |
| 158,888 |
Sales and marketing | 155,491 |
| 147,453 |
| 297,603 |
| 284,886 |
General and administrative | 57,377 |
| 48,962 |
| 97,559 |
| 99,408 |
Amortization of intangible assets | 25,010 |
| 31,718 |
| 49,801 |
| 63,457 |
Restructuring | — |
| 899 |
| — |
| 5,254 |
Total operating expenses | 326,118 |
| 308,266 |
| 615,176 |
| 611,893 |
(Loss) income from operations | (89) |
| 9,464 |
| 33,738 |
| 12,689 |
Interest income | 13,004 |
| 13,765 |
| 26,260 |
| 27,172 |
Interest expense | (29,552) |
| (38,333) |
| (59,009) |
| (77,430) |
Other (expense) income, net | (18,819) |
| 851 |
| (34,485) |
| 7,186 |
Loss before income taxes | (35,456) |
| (14,253) |
| (33,496) |
| (30,383) |
Income tax benefit | (30,807) |
| (19,081) |
| (30,187) |
| (44,545) |
Net (loss) income | $ (4,649) |
| $ 4,828 |
| $ (3,309) |
| $ 14,162 |
Net (loss) income per share attributable to Class A and Class B-1 common stockholders: |
|
|
|
|
|
|
|
Basic | $ (0.02) |
| $ 0.02 |
| $ (0.01) |
| $ 0.05 |
Diluted | $ (0.02) |
| $ 0.02 |
| $ (0.01) |
| $ 0.05 |
Weighted-average shares used in computing net (loss) income per share: |
|
|
|
|
|
|
|
Basic | 302,949 |
| 300,930 |
| 302,811 |
| 298,913 |
Diluted | 302,949 |
| 314,934 |
| 302,811 |
| 313,716 |
CONSOLIDATED BALANCE SHEETS
(in thousands, except par value data)
(Unaudited)
| June 30, |
| December 31, |
| 2025 |
| 2024 |
Assets |
|
|
|
Current assets: |
|
|
|
Cash and cash equivalents | $ 1,052,275 |
| $ 912,460 |
Short-term investments | 246,299 |
| 319,951 |
Accounts receivable, net of allowances of $3,422 and $6,618, respectively | 332,600 |
| 509,826 |
Contract assets, net | 60,196 |
| 60,343 |
Prepaid expenses and other current assets | 243,053 |
| 184,939 |
Total current assets | 1,934,423 |
| 1,987,519 |
Property and equipment, net | 137,365 |
| 138,999 |
Operating lease right-of-use-assets | 53,490 |
| 48,438 |
Goodwill | 2,391,833 |
| 2,326,831 |
Customer relationships intangible asset, net | 510,199 |
| 550,404 |
Other intangible assets, net | 4,873 |
| 5,681 |
Deferred tax assets | 19,025 |
| 18,267 |
Other assets | 203,511 |
| 203,393 |
Total assets | $ 5,254,719 |
| $ 5,279,532 |
Liabilities and Stockholders’ Equity |
|
|
|
Current liabilities: |
|
|
|
Accounts payable | $ 20,767 |
| $ 27,155 |
Accrued liabilities | 54,236 |
| 57,696 |
Accrued compensation and related expenses | 103,673 |
| 148,248 |
Current operating lease liabilities | 14,060 |
| 13,686 |
Current portion of long-term debt | 18,750 |
| 18,750 |
Income taxes payable | 2,957 |
| 5,815 |
Deferred revenue | 746,839 |
| 819,367 |
Total current liabilities | 961,282 |
| 1,090,717 |
Long-term operating lease liabilities | 42,665 |
| 37,771 |
Long-term deferred revenue | 11,180 |
| 13,910 |
Long-term debt, net | 1,782,706 |
| 1,790,401 |
Deferred tax liabilities | 5,998 |
| 7,828 |
Long-term income taxes payable | 27,528 |
| 24,276 |
Other liabilities | 38,823 |
| 7,315 |
Total liabilities | 2,870,182 |
| 2,972,218 |
Stockholders’ equity: |
|
|
|
Class A common stock; $0.01 par value per share; 2,000,000 shares authorized as of June 30, 2025 and December 31, 2024; 260,595 and 259,485 shares issued and outstanding as of June 30, 2025 and December 31, 2024, respectively | 2,607 |
| 2,596 |
Class B-1 common stock; $0.01 par value per share; 200,000 shares authorized as of June 30, 2025 and December 31, 2024; 44,050 shares issued and outstanding as of June 30, 2025 and December 31, 2024 | 440 |
| 440 |
Class B-2 common stock; $0.00001 par value per share; 200,000 shares authorized as of June 30, 2025 and December 31, 2024; 44,050 shares issued and outstanding as of June 30, 2025 and December 31, 2024 | — |
| — |
Additional paid-in-capital | 3,690,869 |
| 3,670,371 |
Accumulated other comprehensive loss | (7,350) |
| (67,383) |
Accumulated deficit | (1,302,029) |
| (1,298,710) |
Total stockholders’ equity | 2,384,537 |
| 2,307,314 |
Total liabilities and stockholders’ equity | $ 5,254,719 |
| $ 5,279,532 |
CONSOLIDATED STATEMENTS OF CASH FLOWS
(in thousands)
(unaudited)
|
| Three Months Ended June 30, |
| Six Months Ended June 30, | ||||
|
| 2025 |
| 2024 |
| 2025 |
| 2024 |
|
|
|
|
|
|
|
|
|
Operating activities: |
|
|
|
|
|
|
|
|
Net (loss) income |
| $ (4,649) |
| $ 4,828 |
| $ (3,309) |
| $ 14,162 |
Adjustments to reconcile net (loss) income to net cash provided by operating activities: |
|
|
|
|
|
|
|
|
Depreciation and amortization |
| 3,504 |
| 3,873 |
| 6,800 |
| 6,066 |
Non-cash operating lease costs |
| 3,124 |
| 3,433 |
| 7,104 |
| 7,335 |
Stock-based compensation |
| 70,392 |
| 65,499 |
| 130,570 |
| 129,600 |
Deferred income taxes |
| 1,806 |
| (745) |
| (1,235) |
| (1,576) |
Amortization of intangible assets and acquired technology |
| 25,548 |
| 32,745 |
| 50,870 |
| 65,518 |
Amortization of debt issuance costs |
| 976 |
| 903 |
| 1,932 |
| 1,790 |
Amortization of investment discount, net of premium |
| (561) |
| (1,408) |
| (1,314) |
| (2,848) |
Debt refinancing costs |
| — |
| 1,366 |
| — |
| 1,366 |
Changes in operating assets and liabilities: |
|
|
|
|
|
|
|
|
Accounts receivable |
| (46,763) |
| (44,290) |
| 185,775 |
| 176,418 |
Prepaid expenses and other assets |
| 6,570 |
| 8,430 |
| 12,868 |
| 8,197 |
Accounts payable and accrued liabilities |
| 24,342 |
| 5,001 |
| (64,019) |
| (92,022) |
Income taxes payable |
| (44,824) |
| (31,305) |
| (50,909) |
| (74,812) |
Deferred revenue |
| (14,889) |
| (23,478) |
| (96,383) |
| (82,700) |
Net cash provided by operating activities |
| 24,576 |
| 24,852 |
| 178,750 |
| 156,494 |
Investing activities: |
|
|
|
|
|
|
|
|
Purchases of property and equipment |
| (1,561) |
| (1,175) |
| (4,708) |
| (1,565) |
Purchases of investments |
| (58,693) |
| (122,558) |
| (234,385) |
| (269,555) |
Maturities of investments |
| 104,000 |
| 52,093 |
| 276,500 |
| 202,032 |
Sales of investments |
| 7,929 |
| — |
| 7,929 |
| — |
Other |
| — |
| — |
| — |
| 1,878 |
Net cash provided by / (used in) investing activities |
| 51,675 |
| (71,640) |
| 45,336 |
| (67,210) |
Financing activities: |
|
|
|
|
|
|
|
|
Payment of debt |
| (4,688) |
| (6,659) |
| (9,376) |
| (11,347) |
Payment of debt refinancing costs |
| — |
| (1,349) |
| — |
| (1,349) |
Proceeds from issuance of debt |
| — |
| 1,971 |
| — |
| 1,971 |
Proceeds from issuance of common stock under employee stock purchase plan |
| — |
| — |
| 14,579 |
| 13,797 |
Payments for dividends related to Class B-2 shares |
| — |
| — |
| (10) |
| (12) |
Payments for repurchases of common stock |
| — |
| — |
| (101,346) |
| — |
Payments for taxes related to net share settlement of equity awards |
| (19,590) |
| (30,848) |
| (48,605) |
| (76,691) |
Proceeds from issuance of shares under equity plans |
| 22,987 |
| 28,860 |
| 23,965 |
| 57,721 |
Net cash used in financing activities |
| (1,291) |
| (8,025) |
| (120,793) |
| (15,910) |
Effect of foreign exchange rate changes on cash and cash equivalents |
| 21,050 |
| (1,790) |
| 36,522 |
| (7,352) |
Net increase (decrease) in cash and cash equivalents |
| 96,010 |
| (56,603) |
| 139,815 |
| 66,022 |
Cash and cash equivalents at beginning of period |
| 956,265 |
| 855,068 |
| 912,460 |
| 732,443 |
Cash and cash equivalents at end of period |
| $ 1,052,275 |
| $ 798,465 |
| $ 1,052,275 |
| $ 798,465 |
Supplemental disclosures: |
|
|
|
|
|
|
|
|
Cash paid for interest |
| $ 30,225 |
| $ 37,922 |
| $ 60,227 |
| $ 75,704 |
Cash paid for income taxes, net of refunds |
| $ 12,128 |
| $ 12,970 |
| $ 21,868 |
| $ 31,843 |
NON-GAAP FINANCIAL MEASURES AND KEY BUSINESS METRICS
(in thousands, except per share data and percentages)
(unaudited)
RECONCILIATIONS OF GAAP TO NON-GAAP
Reconciliation of GAAP net (loss) income to Non-GAAP net income
| Three Months Ended |
| Six Months Ended | ||||
| 2025 |
| 2024 |
| 2025 |
| 2024 |
|
|
|
|
|
|
|
|
| (in thousands) |
| (in thousands) | ||||
GAAP net (loss) income | $ (4,649) |
| $ 4,828 |
| $ (3,309) |
| $ 14,162 |
Stock-based compensation-related charges | 71,886 |
| 68,576 |
| 133,502 |
| 132,677 |
Amortization of intangibles | 25,548 |
| 32,745 |
| 50,870 |
| 65,518 |
Restructuring | — |
| 899 |
| — |
| 5,254 |
Debt refinancing costs | — |
| 1,366 |
| — |
| 1,366 |
Facility impairment | — |
| — |
| 624 |
| — |
Acquisition-related costs | 12,028 |
| 2,403 |
| 12,028 |
| 7,205 |
Sponsor-related costs | — |
| 773 |
| 176 |
| 773 |
Income tax effect | (47,828) |
| (40,358) |
| (67,839) |
| (86,499) |
Non-GAAP net income | $ 56,985 |
| $ 71,232 |
| $ 126,052 |
| $ 140,456 |
|
|
|
|
|
|
|
|
Net (loss) income per share: |
|
|
|
|
|
|
|
Net (loss) income per share—basic | $ (0.02) |
| $ 0.02 |
| $ (0.01) |
| $ 0.05 |
Net (loss) income per share—diluted | $ (0.02) |
| $ 0.02 |
| $ (0.01) |
| $ 0.05 |
Non-GAAP net income per share—basic | $ 0.19 |
| $ 0.24 |
| $ 0.42 |
| $ 0.47 |
Non-GAAP net income per share—diluted | $ 0.18 |
| $ 0.23 |
| $ 0.41 |
| $ 0.45 |
|
|
|
|
|
|
|
|
Share count (in thousands): |
|
|
|
|
|
|
|
Weighted-average shares used in computing net (loss) income per share—basic | 302,949 |
| 300,930 |
| 302,811 |
| 298,913 |
Weighted-average shares used in computing net (loss) income per share—diluted | 302,949 |
| 314,934 |
| 302,811 |
| 313,716 |
Weighted-average shares used in computing Non-GAAP net income per share—basic | 302,949 |
| 300,930 |
| 302,811 |
| 298,913 |
Weighted-average shares used in computing Non-GAAP net income per share—diluted | 308,470 |
| 314,934 |
| 308,515 |
| 313,716 |
Reconciliation of GAAP (loss) income from operations to Non-GAAP income from operations
| Three Months Ended |
| Six Months Ended | ||||
| 2025 |
| 2024 |
| 2025 |
| 2024 |
|
|
|
|
|
|
|
|
| (in thousands) |
| (in thousands) | ||||
GAAP (loss) income from operations | $ (89) |
| $ 9,464 |
| $ 33,738 |
| $ 12,689 |
Stock-based compensation-related charges | 71,886 |
| 68,576 |
| 133,502 |
| 132,677 |
Amortization of intangibles | 25,548 |
| 32,745 |
| 50,870 |
| 65,518 |
Restructuring | — |
| 899 |
| — |
| 5,254 |
Facility impairment | — |
| — |
| 624 |
| — |
Acquisition-related costs | 12,028 |
| 2,403 |
| 12,028 |
| 7,205 |
Sponsor-related costs | — |
| 773 |
| 176 |
| 773 |
Non-GAAP income from operations | $ 109,373 |
| $ 114,860 |
| $ 230,938 |
| $ 224,116 |
|
|
|
|
|
|
|
|
GAAP operating margin (% of total revenue) | 0.0 % |
| 2.4 % |
| 4.2 % |
| 1.6 % |
Non-GAAP operating margin (% of total revenue) | 26.9 % |
| 28.7 % |
| 28.5 % |
| 28.4 % |
NON-GAAP FINANCIAL MEASURES AND KEY BUSINESS METRICS
Adjusted EBITDA Reconciliation
| Three Months Ended |
| Six Months Ended |
| Trailing Twelve Months ("TTM") Ended June 30, | ||||
| 2025 |
| 2024 |
| 2025 |
| 2024 |
| 2025 |
|
|
|
|
|
|
|
|
|
|
| (in thousands) |
| (in thousands) |
| (in thousands) | ||||
GAAP net (loss) income | $ (4,649) |
| $ 4,828 |
| $ (3,309) |
| $ 14,162 |
| $ (7,540) |
Income tax benefit | (30,807) |
| (19,081) |
| (30,187) |
| (44,545) |
| 57,592 |
Interest income | (13,004) |
| (13,765) |
| (26,260) |
| (27,172) |
| (55,525) |
Interest expense | 29,552 |
| 38,333 |
| 59,009 |
| 77,430 |
| 127,643 |
Debt refinancing costs | — |
| 1,366 |
| — |
| 1,366 |
| — |
Other expense (income), net | 18,819 |
| (2,217) |
| 34,485 |
| (8,552) |
| 25,927 |
Stock-based compensation-related charges | 71,886 |
| 68,576 |
| 133,502 |
| 132,677 |
| 263,913 |
Amortization of intangibles | 25,548 |
| 32,745 |
| 50,870 |
| 65,518 |
| 111,097 |
Facility impairment | — |
| — |
| 624 |
| — |
| 624 |
Restructuring | — |
| 899 |
| — |
| 5,254 |
| 7,251 |
Acquisition-related costs | 12,028 |
| 2,403 |
| 12,028 |
| 7,205 |
| 12,392 |
Sponsor-related costs | — |
| 773 |
| 176 |
| 773 |
| 906 |
Depreciation | 3,301 |
| 3,853 |
| 6,605 |
| 6,071 |
| 13,922 |
Adjusted EBITDA | $ 112,674 |
| $ 118,713 |
| $ 237,543 |
| $ 230,187 |
| $ 558,202 |
Adjusted Unlevered Free Cash Flow
| Three Months Ended June 30, |
| Six Months Ended June 30, | ||||
| 2025 |
| 2024 |
| 2025 |
| 2024 |
|
|
|
|
|
|
|
|
| (in thousands, except percentages) |
| (in thousands, except percentages) | ||||
Total GAAP Revenue | $ 407,344 |
| $ 400,625 |
| $ 811,241 |
| $ 789,232 |
Net cash provided by operating activities | $ 24,576 |
| $ 24,852 |
| $ 178,750 |
| $ 156,494 |
Less: Purchases of property and equipment | (1,561) |
| (1,175) |
| (4,708) |
| (1,565) |
Add: Restructuring costs | 652 |
| 2,527 |
| 5,243 |
| 16,473 |
Add: Acquisition related costs | 4,778 |
| 6,682 |
| 4,778 |
| 6,682 |
Add: Sponsor-related costs | 35 |
| 429 |
| 390 |
| 429 |
Adjusted Free Cash Flow (after-tax)(1)(2) | $ 28,480 |
| $ 33,315 |
| $ 184,453 |
| $ 178,513 |
Add: Cash paid for interest | 30,225 |
| 37,922 |
| 60,227 |
| 75,704 |
Adjusted Unlevered Free Cash Flow (after-tax)(1)(2) | $ 58,705 |
| $ 71,237 |
| $ 244,680 |
| $ 254,217 |
|
|
|
|
|
|
|
|
Adjusted Free Cash Flow (after-tax) margin(1)(2) | 7 % |
| 8 % |
| 23 % |
| 23 % |
Adjusted Unlevered Free Cash Flow (after-tax) margin(1)(2) | 14 % |
| 18 % |
| 30 % |
| 32 % |
(1) Includes cash tax payments of $12.1 million and $12.9 million for the three months ended June 30, 2025 and 2024, respectively and $21.8 million and $31.8 million for the six months ended June 30, 2025 and 2024, respectively.
(2) Includes foreign exchange remeasurement (loss) gain of $(13.1) million and $1.9 million for the three months ended June 30, 2025 and 2024, respectively and $(26.4) million and $5.9 million for the six months ended June 30, 2025 and 2024, respectively, primarily from U.S. dollar cash held offshore.
Key Business Metrics
| June 30, | ||
| 2025 |
| 2024 |
|
|
|
|
| (in thousands, except percentages) | ||
Cloud Subscription Annual Recurring Revenue | $ 900,963 |
| $ 702,600 |
Self-managed Subscription Annual Recurring Revenue | 399,177 |
| 493,935 |
Maintenance Annual Recurring Revenue on Perpetual Licenses | 419,548 |
| 471,697 |
Total Annual Recurring Revenue | $ 1,719,688 |
| $ 1,668,232 |
|
|
|
|
Cloud Subscription Net Retention Rate (Global Parent level) | 120 % |
| 126 % |
SUPPLEMENTAL INFORMATION
Additional Business Metrics
| June 30, | ||
| 2025 |
| 2024 |
Maintenance Renewal Rate | 89 % |
| 96 % |
Total Cloud Subscription Annual Recurring Revenue customers | 2,509 |
| 2,340 |
Cloud transactions processed per month in trillions(1) | 128.2 |
| 96.6 |
(1) Total number of cloud transactions processed on our platform per month in trillions, which measures data processed.
Disaggregation of Revenues
| Three Months Ended |
| Six Months Ended | ||||
| 2025 |
| 2024 |
| 2025 |
| 2024 |
| (in thousands) |
| (in thousands) | ||||
Revenues: |
|
|
|
|
|
|
|
Cloud subscription(i) | $ 209,931 |
| $ 161,422 |
| $ 409,866 |
| $ 312,860 |
Self-managed subscription support and other(i) | 40,964 |
| 48,908 |
| 82,460 |
| 97,499 |
Maintenance(ii) | 102,919 |
| 116,482 |
| 206,128 |
| 234,160 |
Total revenue recognized over time | 353,814 |
| 326,812 |
| 698,454 |
| 644,519 |
Self-managed subscription license recognized at a point in time(i)(iii) | 36,139 |
| 53,976 |
| 78,718 |
| 105,945 |
Total subscription and maintenance revenue | 389,953 |
| 380,788 |
| 777,172 |
| 750,464 |
Professional services(ii) | 17,391 |
| 19,837 |
| 34,069 |
| 38,768 |
Total revenues | $ 407,344 |
| $ 400,625 |
| $ 811,241 |
| $ 789,232 |
(i) Included in Subscription revenue on the consolidated statements of operations.
(ii) Included in Maintenance and Professional services revenue on the consolidated statements of operations.
(iii) The Company previously presented Perpetual license revenue separately. Because revenue for perpetual licenses are not material for current or past periods due to our transition to a cloud-only, consumption-driven strategy, the Company has combined these amounts into Self-managed subscription license recognized at a point in time and retrospectively adjusted past periods for comparative purposes.
Revenue recognized over time refers to ratable recognition over the contractual term. Revenue recognized at a point in time refers to recognition upon the later of when the software license is made available or the contractual term commences. Professional services are recognized as services are provided.
Net Debt Reconciliation
| June 30, |
| December 31, |
| 2025 |
| 2024 |
|
|
|
|
| (in millions) | ||
Dollar Term Loan | $ 1,814 |
| $ 1,823 |
Less: Cash, cash equivalents, and short-term investments | (1,299) |
| (1,232) |
Total net debt | $ 515 |
| $ 591 |
INFORMATICA INC.
CONSOLIDATED STATEMENTS OF OPERATIONS
(in thousands, except per share data)
(unaudited)
| Three Months Ended March 31, | ||
| 2024 |
| 2023 |
| (unaudited) | ||
Revenues: |
|
|
|
Subscriptions | $ 251,977 |
| $ 213,922 |
Perpetual license | 21 |
| 806 |
Software revenue | 251,998 |
| 214,728 |
Maintenance and professional services | 136,609 |
| 150,703 |
Total revenues | 388,607 |
| 365,431 |
Cost of revenues: |
|
|
|
Subscriptions | 46,838 |
| 35,684 |
Perpetual license | 5 |
| 180 |
Software costs | 46,843 |
| 35,864 |
Maintenance and professional services | 33,878 |
| 43,159 |
Amortization of acquired technology | 1,034 |
| 2,874 |
Total cost of revenues | 81,755 |
| 81,897 |
Gross profit | 306,852 |
| 283,534 |
Operating expenses: |
|
|
|
Research and development | 79,654 |
| 82,039 |
Sales and marketing | 137,433 |
| 128,538 |
General and administrative | 50,446 |
| 41,360 |
Amortization of intangible assets | 31,739 |
| 34,291 |
Restructuring | 4,355 |
| 27,253 |
Total operating expenses | 303,627 |
| 313,481 |
Income (loss) from operations | 3,225 |
| (29,947) |
Interest income | 13,407 |
| 7,583 |
Interest expense | (39,097) |
| (35,051) |
Other income, net | 6,335 |
| 630 |
Loss before income taxes | (16,130) |
| (56,785) |
Income tax (benefit) expense | (25,464) |
| 59,569 |
Net income (loss) | $ 9,334 |
| $ (116,354) |
Net income (loss) per share attributable to Class A and Class B-1 common stockholders: |
|
|
|
Basic | $ 0.03 |
| $ (0.41) |
Diluted | $ 0.03 |
| $ (0.41) |
Weighted-average shares used in computing net income (loss) per share: |
|
|
|
Basic | 296,897 |
| 284,886 |
Diluted | 312,499 |
| 284,886 |
CONSOLIDATED BALANCE SHEETS
(in thousands, except par value data)
(Unaudited)
| March 31, |
| December 31, |
| 2024 |
| 2023 |
|
|
|
|
Assets |
|
|
|
Current assets: |
|
|
|
Cash and cash equivalents | $ 855,068 |
| $ 732,443 |
Short-term investments | 258,219 |
| 259,828 |
Accounts receivable, net of allowances of $4,669 and $4,414, respectively | 274,724 |
| 500,068 |
Contract assets, net | 85,953 |
| 79,864 |
Prepaid expenses and other current assets | 226,072 |
| 180,383 |
Total current assets | 1,700,036 |
| 1,752,586 |
Property and equipment, net | 147,572 |
| 149,266 |
Operating lease right-of-use-assets | 55,136 |
| 57,799 |
Goodwill | 2,349,119 |
| 2,361,643 |
Customer relationships intangible asset, net | 639,078 |
| 669,781 |
Other intangible assets, net | 13,074 |
| 17,393 |
Deferred tax assets | 15,322 |
| 15,237 |
Other assets | 165,577 |
| 178,377 |
Total assets | $ 5,084,914 |
| $ 5,202,082 |
Liabilities and Stockholders’ Equity |
|
|
|
Current liabilities: |
|
|
|
Accounts payable | $ 20,084 |
| $ 18,050 |
Accrued liabilities | 52,706 |
| 61,194 |
Accrued compensation and related expenses | 77,956 |
| 167,427 |
Current operating lease liabilities | 15,701 |
| 16,411 |
Current portion of long-term debt | 18,750 |
| 18,750 |
Income taxes payable | 2,916 |
| 4,305 |
Deferred revenue | 708,568 |
| 767,244 |
Total current liabilities | 896,681 |
| 1,053,381 |
Long-term operating lease liabilities | 43,255 |
| 46,003 |
Long-term deferred revenue | 13,502 |
| 19,482 |
Long-term debt, net | 1,802,033 |
| 1,805,960 |
Deferred tax liabilities | 21,817 |
| 22,425 |
Long-term income taxes payable | 37,840 |
| 37,679 |
Other liabilities | 6,971 |
| 4,554 |
Total liabilities | 2,822,099 |
| 2,989,484 |
Stockholders’ equity: |
|
|
|
Class A common stock; $0.01 par value per share; 2,000,000 shares authorized as of March 31, 2024 and December 31, 2023, respectively; 255,502 and 250,874 shares issued and outstanding as of March 31, 2024 and December 31, 2023, respectively | 2,556 |
| 2,510 |
Class B-1 common stock; $0.01 par value per share; 200,000 shares authorized as of March 31, 2024 and December 31, 2023, respectively; 44,050 and 44,050 shares issued and outstanding as of March 31, 2024 and December 31, 2023, respectively | 440 |
| 440 |
Class B-2 common stock; $0.00001 par value per share, 200,000 shares authorized as of March 31, 2024 and December 31, 2023, respectively; 44,050 and 44,050 shares issued and outstanding as of March 31, 2024 and December 31, 2023, respectively | — |
| — |
Additional paid-in-capital | 3,601,372 |
| 3,540,502 |
Accumulated other comprehensive loss | (42,391) |
| (22,370) |
Accumulated deficit | (1,299,162) |
| (1,308,484) |
Total stockholders’ equity | 2,262,815 |
| 2,212,598 |
Total liabilities and stockholders’ equity | $ 5,084,914 |
| $ 5,202,082 |
CONSOLIDATED STATEMENTS OF CASH FLOWS
(in thousands)
(unaudited)
|
| Three Months Ended March 31, | ||
|
| 2024 |
| 2023 |
|
|
| ||
Operating activities: |
|
|
|
|
Net income (loss) |
| $ 9,334 |
| $ (116,354) |
Adjustments to reconcile net income (loss) to net cash provided by operating activities: |
|
|
|
|
Depreciation and amortization |
| 2,193 |
| 4,198 |
Non-cash operating lease costs |
| 3,902 |
| 5,350 |
Stock-based compensation |
| 64,101 |
| 50,342 |
Deferred income taxes |
| (831) |
| 11,477 |
Amortization of intangible assets and acquired technology |
| 32,773 |
| 37,165 |
Amortization of debt issuance costs |
| 887 |
| 847 |
Amortization of investment discount, net of premium |
| (1,440) |
| (851) |
Changes in operating assets and liabilities: |
|
|
|
|
Accounts receivable |
| 220,708 |
| 197,579 |
Prepaid expenses and other assets |
| (233) |
| 10,983 |
Accounts payable and accrued liabilities |
| (97,023) |
| (118,076) |
Income taxes payable |
| (43,507) |
| 22,184 |
Deferred revenue |
| (59,222) |
| (34,962) |
Net cash provided by operating activities |
| 131,642 |
| 69,882 |
Investing activities: |
|
|
|
|
Purchases of property and equipment |
| (390) |
| (1,224) |
Purchases of investments |
| (146,997) |
| (30,297) |
Maturities of investments |
| 149,939 |
| 80,500 |
Other |
| 1,878 |
| — |
Net cash provided by investing activities |
| 4,430 |
| 48,979 |
Financing activities: |
|
|
|
|
Payment of debt |
| (4,688) |
| (4,688) |
Proceeds from issuance of common stock under employee stock purchase plan |
| 13,797 |
| 16,131 |
Payments for dividends related to Class B-2 shares |
| (12) |
| (12) |
Payments for taxes related to net share settlement of equity awards |
| (45,843) |
| — |
Proceeds from issuance of shares under equity plans |
| 28,861 |
| 3,481 |
Net cash (used in) / provided by financing activities |
| (7,885) |
| 14,912 |
Effect of foreign exchange rate changes on cash and cash equivalents |
| (5,562) |
| 1,255 |
Net increase in cash and cash equivalents |
| 122,625 |
| 135,028 |
Cash and cash equivalents at beginning of period |
| 732,443 |
| 497,879 |
Cash and cash equivalents at end of period |
| $ 855,068 |
| $ 632,907 |
Supplemental disclosures: |
|
|
|
|
Cash paid for interest |
| $ 37,782 |
| $ 34,482 |
Cash paid for income taxes, net of refunds |
| $ 18,873 |
| $ 25,907 |
NON-GAAP FINANCIAL MEASURES AND KEY BUSINESS METRICS
(in thousands, except per share data)
(unaudited)
RECONCILIATIONS OF GAAP TO NON-GAAP
Reconciliation of GAAP net income (loss) to Non-GAAP net income
| Three Months Ended March 31, | ||
| 2024 |
| 2023 |
| (in thousands) | ||
GAAP net income (loss) | $ 9,334 |
| $ (116,354) |
Stock-based compensation | 64,101 |
| 50,342 |
Amortization of intangibles | 32,773 |
| 37,165 |
Restructuring | 4,355 |
| 27,253 |
Acquisition related costs | 4,802 |
| — |
Income tax effect | (46,141) |
| 46,235 |
Non-GAAP net income | $ 69,224 |
| $ 44,641 |
|
|
|
|
Net income (loss) per share: |
|
|
|
Net income (loss) per share—basic | $ 0.03 |
| $ (0.41) |
Net income (loss) per share—diluted | $ 0.03 |
| $ (0.41) |
Non-GAAP net income per share—basic | $ 0.23 |
| $ 0.16 |
Non-GAAP net income per share—diluted | $ 0.22 |
| $ 0.15 |
|
|
|
|
Share count (in thousands): |
|
|
|
Weighted-average shares used in computing net income (loss) per share—basic | 296,897 |
| 284,886 |
Weighted-average shares used in computing net income (loss) per share—diluted | 312,499 |
| 284,886 |
Weighted-average shares used in computing Non-GAAP net income per share—basic | 296,897 |
| 284,886 |
Weighted-average shares used in computing Non-GAAP net income per share—diluted | 312,499 |
| 288,632 |
Reconciliation of GAAP income (loss) from operations to Non-GAAP income from operations
| Three Months Ended March 31, | ||
| 2024 |
| 2023 |
| (in thousands) | ||
GAAP income (loss) from operations | $ 3,225 |
| $ (29,947) |
Stock-based compensation | 64,101 |
| 50,342 |
Amortization of intangibles | 32,773 |
| 37,165 |
Restructuring | 4,355 |
| 27,253 |
Acquisition related costs | 4,802 |
| — |
Non-GAAP income from operations | $ 109,256 |
| $ 84,813 |
NON-GAAP FINANCIAL MEASURES AND KEY BUSINESS METRICS
Adjusted EBITDA Reconciliation
| Three Months Ended March 31, |
| Trailing Twelve Months ("TTM") Ended March 31, | ||
| 2024 |
| 2023 |
| 2024 |
| (in thousands) |
| (in thousands) | ||
GAAP net income (loss) | $ 9,334 |
| $ (116,354) |
| $ 405 |
Income tax (benefit) expense | (25,464) |
| 59,569 |
| (36,922) |
Interest income | (13,407) |
| (7,583) |
| (45,510) |
Interest expense | 39,097 |
| 35,051 |
| 155,442 |
Other income, net | (6,335) |
| (630) |
| (6,680) |
Stock-based compensation | 64,101 |
| 50,342 |
| 231,858 |
Amortization of intangibles | 32,773 |
| 37,165 |
| 144,888 |
Restructuring | 4,355 |
| 27,253 |
| 36,857 |
Acquisition related costs | 4,802 |
| — |
| 6,386 |
Depreciation | 2,218 |
| 4,200 |
| 15,101 |
Adjusted EBITDA | $ 111,474 |
| $ 89,013 |
| $ 501,825 |
Adjusted Unlevered Free Cash Flows
| Three Months Ended March 31, | ||
| 2024 |
| 2023 |
| (in thousands, except percentages) | ||
Total GAAP Revenue | 388,607 |
| 365,431 |
Net cash provided by operating activities | 131,642 |
| 69,882 |
Less: Purchases of property, plant, and equipment | (390) |
| (1,224) |
Add: Equity compensation payments | — |
| 68 |
Add: Restructuring costs | 13,946 |
| 20,144 |
Adjusted Free Cash Flow (after-tax)(1) | 145,198 |
| 88,870 |
Add: Cash paid for interest | 37,782 |
| 34,482 |
Adjusted Unlevered Free Cash Flows (after-tax)(1) | $ 182,980 |
| $ 123,352 |
|
|
|
|
Adjusted Free Cash Flow (after-tax) margin(1) | 37 % |
| 24 % |
Adjusted Unlevered Free Cash Flows (after-tax) margin(1) | 47 % |
| 34 % |
(1) Includes cash tax payments of $18.9 million and $25.9 million for the three months ended March 31, 2024 and 2023, respectively.
Key Business Metrics
| March 31, | ||
| 2024 |
| 2023 |
| (in thousands, except percentages) | ||
Cloud Subscription Annual Recurring Revenue | $ 652,545 |
| $ 483,294 |
Self-managed Subscription Annual Recurring Revenue | 505,148 |
| 537,612 |
Subscription Annual Recurring Revenue | 1,157,693 |
| 1,020,906 |
Maintenance Annual Recurring Revenue on Perpetual Licenses | 478,801 |
| 512,497 |
Total Annual Recurring Revenue | $ 1,636,494 |
| $ 1,533,403 |
|
|
|
|
Subscription Net Retention Rate (End-user level) | 105 % |
| 110 % |
Cloud Subscription Net Retention Rate (End-user level) | 119 % |
| 118 % |
Cloud Subscription Net Retention Rate (Global Parent level) | 124 % |
| 124 % |
SUPPLEMENTAL INFORMATION
Additional Business Metrics
| March 31, | ||
| 2024 |
| 2023 |
Maintenance Renewal Rate | 94 % |
| 96 % |
Subscription Renewal Rate | 91 % |
| 93 % |
Customers that spend more than $1 million in Subscription Annual Recurring Revenue (1) | 258 |
| 208 |
Customers that spend more than $100,000 in Subscription Annual Recurring Revenue (2) | 2,007 |
| 1,921 |
Cloud transactions processed per month in trillions (3) | 91.8 |
| 54.3 |
(1) Total number of customers that spend more than $1 million in Subscription Annual Recurring Revenue.
(2) Total number of customers that spend more than $100,000 in Subscription Annual Recurring Revenue.
(3) Total number of cloud transactions processed on our platform per month in trillions, which measures data processed.
Disaggregation of Subscription Revenues
| Three Months Ended March 31, | ||
| 2024 |
| 2023 |
| (in thousands) | ||
Revenues: |
|
|
|
Cloud subscription | $ 151,438 |
| $ 111,778 |
Self-managed subscription license | 51,948 |
| 50,549 |
Self-managed subscription support and other | 48,591 |
| 51,595 |
Subscription revenues | $ 251,977 |
| $ 213,922 |
Net Debt Reconciliation
| March 31, |
| December 31 |
| 2024 |
| 2023 |
| (in millions) | ||
Dollar Term Loan | $ 1,838 |
| $ 1,842 |
Less: Cash, cash equivalents, and short-term investments | (1,113) |
| (992) |
Total net debt | $ 725 |
| $ 850 |
INFORMATICA INC.
CONSOLIDATED STATEMENTS OF OPERATIONS
(in thousands, except per share data)
(unaudited)
| Three Months Ended June 30, |
| Six Months Ended June 30, | ||||
| 2024 |
| 2023 |
| 2024 |
| 2023 |
|
|
|
|
|
|
|
|
Revenues: |
|
|
|
|
|
|
|
Subscriptions | $ 264,306 |
| $ 227,589 |
| $ 516,283 |
| $ 441,511 |
Perpetual license | — |
| 13 |
| 21 |
| 819 |
Software revenue | 264,306 |
| 227,602 |
| 516,304 |
| 442,330 |
Maintenance and professional services | 136,319 |
| 148,386 |
| 272,928 |
| 299,089 |
Total revenues | 400,625 |
| 375,988 |
| 789,232 |
| 741,419 |
Cost of revenues: |
|
|
|
|
|
|
|
Subscriptions | 47,367 |
| 38,626 |
| 94,205 |
| 74,310 |
Perpetual license | — |
| 213 |
| 5 |
| 393 |
Software costs | 47,367 |
| 38,839 |
| 94,210 |
| 74,703 |
Maintenance and professional services | 34,501 |
| 43,864 |
| 68,379 |
| 87,023 |
Amortization of acquired technology | 1,027 |
| 2,889 |
| 2,061 |
| 5,763 |
Total cost of revenues | 82,895 |
| 85,592 |
| 164,650 |
| 167,489 |
Gross profit | 317,730 |
| 290,396 |
| 624,582 |
| 573,930 |
Operating expenses: |
|
|
|
|
|
|
|
Research and development | 79,234 |
| 87,707 |
| 158,888 |
| 169,746 |
Sales and marketing | 147,453 |
| 134,500 |
| 284,886 |
| 263,038 |
General and administrative | 48,962 |
| 38,756 |
| 99,408 |
| 80,116 |
Amortization of intangible assets | 31,718 |
| 34,348 |
| 63,457 |
| 68,639 |
Restructuring | 899 |
| 471 |
| 5,254 |
| 27,724 |
Total operating expenses | 308,266 |
| 295,782 |
| 611,893 |
| 609,263 |
Income (loss) from operations | 9,464 |
| (5,386) |
| 12,689 |
| (35,333) |
Interest income | 13,765 |
| 9,920 |
| 27,172 |
| 17,503 |
Interest expense | (38,333) |
| (37,466) |
| (77,430) |
| (72,517) |
Other income, net | 851 |
| 2,531 |
| 7,186 |
| 3,161 |
Loss before income taxes | (14,253) |
| (30,401) |
| (30,383) |
| (87,186) |
Income tax (benefit) expense | (19,081) |
| 122,065 |
| (44,545) |
| 181,634 |
Net income (loss) | $ 4,828 |
| $ (152,466) |
| $ 14,162 |
| $ (268,820) |
Net income (loss) per share attributable to Class A and Class B-1 common stockholders: |
|
|
|
|
|
|
|
Basic | $ 0.02 |
| $ (0.53) |
| $ 0.05 |
| $ (0.94) |
Diluted | $ 0.02 |
| $ (0.53) |
| $ 0.05 |
| $ (0.94) |
Weighted-average shares used in computing net income (loss) per share: |
|
|
|
|
|
|
|
Basic | 300,930 |
| 287,109 |
| 298,913 |
| 286,004 |
Diluted | 314,934 |
| 287,109 |
| 313,716 |
| 286,004 |
CONSOLIDATED BALANCE SHEETS
(in thousands, except par value data)
(Unaudited)
| June 30, |
| December 31, |
| 2024 |
| 2023 |
Assets |
|
|
|
Current assets: |
|
|
|
Cash and cash equivalents | $ 798,465 |
| $ 732,443 |
Short-term investments | 330,072 |
| 259,828 |
Accounts receivable, net of allowances of $4,787 and $4,414, respectively | 318,739 |
| 500,068 |
Contract assets, net | 83,172 |
| 79,864 |
Prepaid expenses and other current assets | 252,689 |
| 180,383 |
Total current assets | 1,783,137 |
| 1,752,586 |
Property and equipment, net | 144,137 |
| 149,266 |
Operating lease right-of-use-assets | 51,351 |
| 57,799 |
Goodwill | 2,345,753 |
| 2,361,643 |
Customer relationships intangible asset, net | 609,927 |
| 669,781 |
Other intangible assets, net | 8,830 |
| 17,393 |
Deferred tax assets | 15,415 |
| 15,237 |
Other assets | 163,255 |
| 178,377 |
Total assets | $ 5,121,805 |
| $ 5,202,082 |
Liabilities and Stockholders’ Equity |
|
|
|
Current liabilities: |
|
|
|
Accounts payable | $ 20,506 |
| $ 18,050 |
Accrued liabilities | 43,863 |
| 61,194 |
Accrued compensation and related expenses | 94,317 |
| 167,427 |
Current operating lease liabilities | 14,834 |
| 16,411 |
Current portion of long-term debt | 18,750 |
| 18,750 |
Income taxes payable | 869 |
| 4,305 |
Deferred revenue | 685,734 |
| 767,244 |
Total current liabilities | 878,873 |
| 1,053,381 |
Long-term operating lease liabilities | 39,932 |
| 46,003 |
Long-term deferred revenue | 11,805 |
| 19,482 |
Long-term debt, net | 1,798,140 |
| 1,805,960 |
Deferred tax liabilities | 20,728 |
| 22,425 |
Long-term income taxes payable | 40,110 |
| 37,679 |
Other liabilities | 6,401 |
| 4,554 |
Total liabilities | 2,795,989 |
| 2,989,484 |
Stockholders’ equity: |
|
|
|
Class A common stock; $0.01 par value per share; 2,000,000 and 2,000,000 shares authorized as of June 30, 2024 and December 31, 2023, respectively; 258,810 and 250,874 shares issued and outstanding as of June 30, 2024 and December 31, 2023, respectively | 2,589 |
| 2,510 |
Class B-1 common stock; $0.01 par value per share; 200,000 and 200,000 shares authorized as of June 30, 2024 and December 31, 2023, respectively; 44,050 and 44,050 shares issued and outstanding as of June 30, 2024 and December 31, 2023, respectively | 440 |
| 440 |
Class B-2 common stock; $0.00001 par value per share; 200,000 and 200,000 shares authorized as of June 30, 2024 and December 31, 2023, respectively; 44,050 and 44,050 shares issued and outstanding as of June 30, 2024 and December 31, 2023, respectively | — |
| — |
Additional paid-in-capital | 3,664,821 |
| 3,540,502 |
Accumulated other comprehensive loss | (47,700) |
| (22,370) |
Accumulated deficit | (1,294,334) |
| (1,308,484) |
Total stockholders’ equity | 2,325,816 |
| 2,212,598 |
Total liabilities and stockholders’ equity | $ 5,121,805 |
| $ 5,202,082 |
CONSOLIDATED STATEMENTS OF CASH FLOWS
(in thousands)
(unaudited)
|
| Three Months Ended June 30, |
| Six Months Ended June 30, | ||||
|
| 2024 |
| 2023 |
| 2024 |
| 2023 |
|
|
|
|
|
|
|
|
|
Operating activities: |
|
|
|
|
|
|
|
|
Net income (loss) |
| $ 4,828 |
| $ (152,466) |
| $ 14,162 |
| $ (268,820) |
Adjustments to reconcile net income (loss) to net cash provided by operating activities: |
|
|
|
|
|
|
|
|
Depreciation and amortization |
| 3,873 |
| 4,273 |
| 6,066 |
| 8,471 |
Non-cash operating lease costs |
| 3,433 |
| 3,674 |
| 7,335 |
| 9,024 |
Stock-based compensation |
| 65,499 |
| 55,208 |
| 129,600 |
| 105,550 |
Deferred income taxes |
| (745) |
| (7,479) |
| (1,576) |
| 3,998 |
Amortization of intangible assets and acquired technology |
| 32,745 |
| 37,237 |
| 65,518 |
| 74,402 |
Amortization of debt issuance costs |
| 903 |
| 857 |
| 1,790 |
| 1,704 |
Amortization of investment discount, net of premium |
| (1,408) |
| (900) |
| (2,848) |
| (1,751) |
Debt refinancing costs |
| 1,366 |
| — |
| 1,366 |
| — |
Changes in operating assets and liabilities: |
|
|
|
|
|
|
|
|
Accounts receivable |
| (44,290) |
| (38,332) |
| 176,418 |
| 159,247 |
Prepaid expenses and other assets |
| 8,430 |
| 16,098 |
| 8,197 |
| 27,081 |
Accounts payable and accrued liabilities |
| 5,001 |
| 14,749 |
| (92,022) |
| (103,327) |
Income taxes payable |
| (31,305) |
| 106,566 |
| (74,812) |
| 128,750 |
Deferred revenue |
| (23,478) |
| (2,780) |
| (82,700) |
| (37,742) |
Net cash provided by operating activities |
| 24,852 |
| 36,705 |
| 156,494 |
| 106,587 |
Investing activities: |
|
|
|
|
|
|
|
|
Purchases of property and equipment |
| (1,175) |
| (1,891) |
| (1,565) |
| (3,115) |
Purchases of investments |
| (122,558) |
| (117,628) |
| (269,555) |
| (147,925) |
Maturities of investments |
| 52,093 |
| 71,200 |
| 202,032 |
| 151,700 |
Sales of investments |
| — |
| 23,798 |
| — |
| 23,798 |
Other |
| — |
| — |
| 1,878 |
| — |
Net cash (used in) provided by investing activities |
| (71,640) |
| (24,521) |
| (67,210) |
| 24,458 |
Financing activities: |
|
|
|
|
|
|
|
|
Payment of debt |
| (6,659) |
| (4,688) |
| (11,347) |
| (9,376) |
Payment of debt refinancing costs |
| (1,349) |
| — |
| (1,349) |
| — |
Proceeds from issuance of debt |
| 1,971 |
| — |
| 1,971 |
| — |
Proceeds from issuance of common stock under employee stock purchase plan |
| — |
| — |
| 13,797 |
| 16,131 |
Payments for dividends related to Class B-2 shares |
| — |
| — |
| (12) |
| (12) |
Payments for taxes related to net share settlement of equity awards |
| (30,848) |
| (11,100) |
| (76,691) |
| (11,100) |
Proceeds from issuance of shares under equity plans |
| 28,860 |
| 4,172 |
| 57,721 |
| 7,653 |
Net cash (used in) provided by financing activities |
| (8,025) |
| (11,616) |
| (15,910) |
| 3,296 |
Effect of foreign exchange rate changes on cash and cash equivalents |
| (1,790) |
| (672) |
| (7,352) |
| 583 |
Net increase in cash and cash equivalents |
| (56,603) |
| (104) |
| 66,022 |
| 134,924 |
Cash and cash equivalents at beginning of period |
| 855,068 |
| 632,907 |
| 732,443 |
| 497,879 |
Cash and cash equivalents at end of period |
| $ 798,465 |
| $ 632,803 |
| $ 798,465 |
| $ 632,803 |
Supplemental disclosures: |
|
|
|
|
|
|
|
|
Cash paid for interest |
| $ 37,922 |
| $ 36,580 |
| $ 75,704 |
| $ 71,062 |
Cash paid for income taxes, net of refunds |
| $ 12,970 |
| $ 22,979 |
| $ 31,843 |
| $ 48,886 |
NON-GAAP FINANCIAL MEASURES AND KEY BUSINESS METRICS
(in thousands, except per share data)
(unaudited)
RECONCILIATIONS OF GAAP TO NON-GAAP
Reconciliation of GAAP net income (loss) to Non-GAAP net income
| Three Months Ended June 30, |
| Six Months Ended June 30, | ||||
| 2024 |
| 2023 |
| 2024 |
| 2023 |
|
|
|
|
|
|
|
|
| (in thousands) |
| (in thousands) | ||||
GAAP net income (loss) | $ 4,828 |
| $ (152,466) |
| $ 14,162 |
| $ (268,820) |
Stock-based compensation-related charges (1) | 68,576 |
| 55,208 |
| 132,677 |
| 105,550 |
Amortization of intangibles | 32,745 |
| 37,237 |
| 65,518 |
| 74,402 |
Restructuring | 899 |
| 471 |
| 5,254 |
| 27,724 |
Debt refinancing costs | 1,366 |
| — |
| 1,366 |
| — |
Acquisition-related costs | 2,403 |
| — |
| 7,205 |
| — |
Sponsor-related costs | 773 |
| — |
| 773 |
| — |
Income tax effect | (40,358) |
| 107,687 |
| (86,499) |
| 153,922 |
Non-GAAP net income | $ 71,232 |
| $ 48,137 |
| $ 140,456 |
| $ 92,778 |
|
|
|
|
|
|
|
|
Net income (loss) per share: |
|
|
|
|
|
|
|
Net income (loss) per share—basic | $ 0.02 |
| $ (0.53) |
| $ 0.05 |
| $ (0.94) |
Net income (loss) per share—diluted | $ 0.02 |
| $ (0.53) |
| $ 0.05 |
| $ (0.94) |
Non-GAAP net income per share—basic | $ 0.24 |
| $ 0.17 |
| $ 0.47 |
| $ 0.32 |
Non-GAAP net income per share—diluted | $ 0.23 |
| $ 0.17 |
| $ 0.45 |
| $ 0.32 |
|
|
|
|
|
|
|
|
Share count (in thousands): |
|
|
|
|
|
|
|
Weighted-average shares used in computing net income (loss) per share—basic | 300,930 |
| 287,109 |
| 298,913 |
| 286,004 |
Weighted-average shares used in computing net income (loss) per share—diluted | 314,934 |
| 287,109 |
| 313,716 |
| 286,004 |
Weighted-average shares used in computing Non-GAAP net income per share—basic | 300,930 |
| 287,109 |
| 298,913 |
| 286,004 |
Weighted-average shares used in computing Non-GAAP net income per share—diluted | 314,934 |
| 290,980 |
| 313,716 |
| 289,812 |
(1) Beginning with the second quarter of 2024, the Company adjusted for employer payroll tax-related items on employee stock transactions in certain non-GAAP metrics. The stock-based compensation related employer tax-related expense for comparative periods were immaterial and are not reflected in the balances above.
Reconciliation of GAAP income (loss) from operations to Non-GAAP income from operations
| Three Months Ended June 30, |
| Six Months Ended June 30, | ||||
| 2024 |
| 2023 |
| 2024 |
| 2023 |
|
|
|
|
|
|
|
|
| (in thousands) |
| (in thousands) | ||||
GAAP income (loss) from operations | $ 9,464 |
| $ (5,386) |
| $ 12,689 |
| $ (35,333) |
Stock-based compensation-related charges | 68,576 |
| 55,208 |
| 132,677 |
| 105,550 |
Amortization of intangibles | 32,745 |
| 37,237 |
| 65,518 |
| 74,402 |
Restructuring | 899 |
| 471 |
| 5,254 |
| 27,724 |
Acquisition-related costs | 2,403 |
| — |
| 7,205 |
| — |
Sponsor-related costs | 773 |
| — |
| 773 |
| — |
Non-GAAP income from operations | $ 114,860 |
| $ 87,530 |
| $ 224,116 |
| $ 172,343 |
|
|
|
|
|
|
|
|
Non-GAAP operating margin (% of total revenue) | 28.7 % |
| 23.3 % |
| 28.4 % |
| 23.2 % |
NON-GAAP FINANCIAL MEASURES AND KEY BUSINESS METRICS
Adjusted EBITDA Reconciliation
| Three Months Ended June 30, |
| Six Months Ended June 30, |
| Trailing Twelve Months ("TTM") Ended June 30, | ||||
| 2024 |
| 2023 |
| 2024 |
| 2023 |
| 2024 |
|
|
|
|
|
|
|
|
|
|
| (in thousands) |
| (in thousands) |
| (in thousands) | ||||
GAAP net income (loss) | $ 4,828 |
| $ (152,466) |
| $ 14,162 |
| $ (268,820) |
| $ 157,699 |
Income tax (benefit) expense | (19,081) |
| 122,065 |
| (44,545) |
| 181,634 |
| (178,068) |
Interest income | (13,765) |
| (9,920) |
| (27,172) |
| (17,503) |
| (49,355) |
Interest expense | 38,333 |
| 37,466 |
| 77,430 |
| 72,517 |
| 156,309 |
Debt refinancing costs | 1,366 |
| — |
| 1,366 |
| — |
| 1,366 |
Other income, net | (2,217) |
| (2,531) |
| (8,552) |
| (3,161) |
| (6,366) |
Stock-based compensation-related charges | 68,576 |
| 55,208 |
| 132,677 |
| 105,550 |
| 245,226 |
Amortization of intangibles | 32,745 |
| 37,237 |
| 65,518 |
| 74,402 |
| 140,396 |
Restructuring | 899 |
| 471 |
| 5,254 |
| 27,724 |
| 37,285 |
Acquisition-related costs | 2,403 |
| — |
| 7,205 |
| — |
| 8,789 |
Sponsor-related costs | 773 |
| — |
| 773 |
| — |
| 773 |
Depreciation | 3,853 |
| 4,208 |
| 6,071 |
| 8,408 |
| 14,746 |
Adjusted EBITDA | $ 118,713 |
| $ 91,738 |
| $ 230,187 |
| $ 180,751 |
| $ 528,800 |
Adjusted Unlevered Free Cash Flow
| Three Months Ended June 30, |
| Six Months Ended June 30, | ||||
| 2024 |
| 2023 |
| 2024 |
| 2023 |
|
|
|
|
|
|
|
|
| (in thousands, except percentages) |
| (in thousands, except percentages) | ||||
Total GAAP Revenue | $ 400,625 |
| $ 375,988 |
| $ 789,232 |
| $ 741,419 |
Net cash provided by operating activities | $ 24,852 |
| $ 36,705 |
| $ 156,494 |
| $ 106,587 |
Less: Purchases of property, plant, and equipment | (1,175) |
| (1,891) |
| (1,565) |
| (3,115) |
Add: Equity compensation payments | — |
| 53 |
| — |
| 121 |
Add: Restructuring costs | 2,527 |
| 5,476 |
| 16,473 |
| 25,620 |
Add: Acquisition related costs | 6,682 |
| — |
| 6,682 |
| — |
Add: Sponsor-related costs | 429 |
| — |
| 429 |
| — |
Adjusted Free Cash Flow (after-tax)(1) | $ 33,315 |
| $ 40,343 |
| $ 178,513 |
| $ 129,213 |
Add: Cash paid for interest | 37,922 |
| 36,580 |
| 75,704 |
| 71,062 |
Adjusted Unlevered Free Cash Flow (after-tax)(1) | $ 71,237 |
| $ 76,923 |
| $ 254,217 |
| $ 200,275 |
|
|
|
|
|
|
|
|
Adjusted Free Cash Flow (after-tax) margin(1) | 8 % |
| 11 % |
| 23 % |
| 17 % |
Adjusted Unlevered Free Cash Flow (after-tax) margin(1) | 18 % |
| 20 % |
| 32 % |
| 27 % |
(1) Includes cash tax payments of $12.9 million and $23.0 million for the three months ended June 30, 2024 and 2023, respectively and $31.8 million and $48.9 million for the six months ended June 30, 2024 and 2023, respectively.
Key Business Metrics
| June 30, | ||
| 2024 |
| 2023 |
|
|
|
|
| (in thousands, except percentages) | ||
Cloud Subscription Annual Recurring Revenue | $ 702,600 |
| $ 512,615 |
Self-managed Subscription Annual Recurring Revenue | 493,935 |
| 529,723 |
Subscription Annual Recurring Revenue | 1,196,535 |
| 1,042,338 |
Maintenance Annual Recurring Revenue on Perpetual Licenses | 471,697 |
| 505,186 |
Total Annual Recurring Revenue | $ 1,668,232 |
| $ 1,547,524 |
|
|
|
|
Subscription Net Retention Rate (End-user level) | 106 % |
| 107 % |
Cloud Subscription Net Retention Rate (End-user level) | 119 % |
| 116 % |
Cloud Subscription Net Retention Rate (Global Parent level) | 126 % |
| 122 % |
SUPPLEMENTAL INFORMATION
Additional Business Metrics
| June 30, | ||
| 2024 |
| 2023 |
Maintenance Renewal Rate | 96 % |
| 94 % |
Subscription Renewal Rate | 90 % |
| 92 % |
Customers that spend more than $1 million in Subscription Annual Recurring Revenue(1) | 272 |
| 213 |
Customers that spend more than $100,000 in Subscription Annual Recurring Revenue(2) | 2,038 |
| 1,940 |
Cloud transactions processed per month in trillions(3) | 96.6 |
| 60.7 |
(1) Total number of customers that spend more than $1 million in Subscription Annual Recurring Revenue.
(2) Total number of customers that spend more than $100,000 in Subscription Annual Recurring Revenue.
(3) Total number of cloud transactions processed on our platform per month in trillions, which measures data processed.
Disaggregation of Subscription Revenues
| Three Months Ended June 30, |
| Six Months Ended June 30, | ||||
| 2024 |
| 2023 |
| 2024 |
| 2023 |
| (in thousands) |
| (in thousands) | ||||
Revenues: |
|
|
|
|
|
|
|
Cloud subscription | $ 161,422 |
| $ 119,244 |
| $ 312,860 |
| $ 231,022 |
Self-managed subscription license | 53,976 |
| 56,878 |
| 105,924 |
| 107,427 |
Self-managed subscription support and other | 48,908 |
| 51,467 |
| 97,499 |
| 103,062 |
Subscription revenues | $ 264,306 |
| $ 227,589 |
| $ 516,283 |
| $ 441,511 |
Net Debt Reconciliation
| June 30, |
| December 31 |
| 2024 |
| 2023 |
|
|
|
|
| (in millions) | ||
Dollar Term Loan | $ 1,833 |
| $ 1,842 |
Less: Cash, cash equivalents, and short-term investments | (1,129) |
| (992) |
Total net debt | $ 704 |
| $ 850 |
INFORMATICA INC.
CONSOLIDATED STATEMENTS OF OPERATIONS
(in thousands, except per share data)
(unaudited)
|
Three Months Ended September 30, |
|
Nine Months Ended September 30, |
||||
|
2025 |
|
2024 |
|
2025 |
|
2024 |
|
|
|
|
|
|
|
|
Revenues: |
|
|
|
|
|
|
|
Subscription revenue |
$ 320,661 |
|
$ 287,934 |
|
$ 891,705 |
|
$ 804,238 |
Maintenance and professional services |
118,500 |
|
134,547 |
|
358,697 |
|
407,475 |
Total revenues |
439,161 |
|
422,481 |
|
1,250,402 |
|
1,211,713 |
Cost of revenues: |
|
|
|
|
|
|
|
Subscription costs |
53,426 |
|
48,768 |
|
160,777 |
|
142,978 |
Maintenance and professional services costs |
26,999 |
|
31,894 |
|
80,906 |
|
100,273 |
Amortization of acquired technology |
540 |
|
947 |
|
1,609 |
|
3,008 |
Total cost of revenues |
80,965 |
|
81,609 |
|
243,292 |
|
246,259 |
Gross profit |
358,196 |
|
340,872 |
|
1,007,110 |
|
965,454 |
Operating expenses: |
|
|
|
|
|
|
|
Research and development |
85,356 |
|
80,316 |
|
255,569 |
|
239,204 |
Sales and marketing |
139,539 |
|
133,517 |
|
437,142 |
|
418,403 |
General and administrative |
47,296 |
|
44,707 |
|
144,855 |
|
144,115 |
Amortization of intangible assets |
25,139 |
|
29,845 |
|
74,940 |
|
93,302 |
Restructuring |
— |
|
1,554 |
|
— |
|
6,808 |
Total operating expenses |
297,330 |
|
289,939 |
|
912,506 |
|
901,832 |
Income from operations |
60,866 |
|
50,933 |
|
94,604 |
|
63,622 |
Interest income |
13,751 |
|
14,829 |
|
40,011 |
|
42,001 |
Interest expense |
(29,749) |
|
(36,345) |
|
(88,758) |
|
(113,775) |
Other income (expense), net |
4,185 |
|
(14,011) |
|
(30,300) |
|
(6,825) |
Income (loss) before income taxes |
49,053 |
|
15,406 |
|
15,557 |
|
(14,977) |
Income tax expense (benefit) |
45,055 |
|
29,391 |
|
14,868 |
|
(15,154) |
Net income (loss) |
$ 3,998 |
|
$ (13,985) |
|
$ 689 |
|
$ 177 |
Net income (loss) per share attributable to Class A and Class B-1 common stockholders: |
|
|
|
|
|
|
|
Basic |
$ 0.01 |
|
$ (0.05) |
|
$ 0.00 |
|
$ 0.00 |
Diluted |
$ 0.01 |
|
$ (0.05) |
|
$ 0.00 |
|
$ 0.00 |
Weighted-average shares used in computing net income (loss) per share: |
|
|
|
|
|
|
|
Basic |
306,268 |
|
303,954 |
|
303,976 |
|
300,606 |
Diluted |
314,515 |
|
303,954 |
|
310,528 |
|
313,363 |
CONSOLIDATED BALANCE SHEETS
(in thousands, except par value data)
(Unaudited)
|
September 30, |
|
December 31, |
|
2025 |
|
2024 |
Assets |
|
|
|
Current assets: |
|
|
|
Cash and cash equivalents |
$ 1,349,474 |
|
$ 912,460 |
Short-term investments |
122,675 |
|
319,951 |
Accounts receivable, net of allowances of $3,249 and $6,618, respectively |
328,237 |
|
509,826 |
Contract assets, net |
54,742 |
|
60,343 |
Prepaid expenses and other current assets |
190,223 |
|
184,939 |
Total current assets |
2,045,351 |
|
1,987,519 |
Property and equipment, net |
135,576 |
|
138,999 |
Operating lease right-of-use-assets |
50,417 |
|
48,438 |
Goodwill |
2,386,626 |
|
2,326,831 |
Customer relationships intangible asset, net |
484,757 |
|
550,404 |
Other intangible assets, net |
4,275 |
|
5,681 |
Deferred tax assets |
20,909 |
|
18,267 |
Other assets |
168,719 |
|
203,393 |
Total assets |
$ 5,296,630 |
|
$ 5,279,532 |
Liabilities and Stockholders’ Equity |
|
|
|
Current liabilities: |
|
|
|
Accounts payable |
$ 21,222 |
|
$ 27,155 |
Accrued liabilities |
49,951 |
|
57,696 |
Accrued compensation and related expenses |
111,516 |
|
148,248 |
Current operating lease liabilities |
13,519 |
|
13,686 |
Current portion of long-term debt |
18,750 |
|
18,750 |
Income taxes payable |
2,196 |
|
5,815 |
Deferred revenue |
729,046 |
|
819,367 |
Total current liabilities |
946,200 |
|
1,090,717 |
Long-term operating lease liabilities |
40,077 |
|
37,771 |
Long-term deferred revenue |
9,613 |
|
13,910 |
Long-term debt, net |
1,778,891 |
|
1,790,401 |
Deferred tax liabilities |
5,371 |
|
7,828 |
Long-term income taxes payable |
31,349 |
|
24,276 |
Other liabilities |
36,559 |
|
7,315 |
Total liabilities |
2,848,060 |
|
2,972,218 |
Stockholders’ equity: |
|
|
|
Class A common stock; $0.01 par value per share; 2,000,000 shares authorized as of September 30, 2025 and December 31, 2024; 264,301 and 259,485 shares issued and outstanding as of September 30, 2025 and December 31, 2024, respectively |
2,644 |
|
2,596 |
Class B-1 common stock; $0.01 par value per share; 200,000 shares authorized as of September 30, 2025 and December 31, 2024; 44,050 shares issued and outstanding as of September 30, 2025 and December 31, 2024 |
440 |
|
440 |
Class B-2 common stock; $0.00001 par value per share; 200,000 shares authorized as of September 30, 2025 and December 31, 2024; 44,050 shares issued and outstanding as of September 30, 2025 and December 31, 2024 |
— |
|
— |
Additional paid-in-capital |
3,767,726 |
|
3,670,371 |
Accumulated other comprehensive loss |
(24,209) |
|
(67,383) |
Accumulated deficit |
(1,298,031) |
|
(1,298,710) |
Total stockholders’ equity |
2,448,570 |
|
2,307,314 |
Total liabilities and stockholders’ equity |
$ 5,296,630 |
|
$ 5,279,532 |
CONSOLIDATED STATEMENTS OF CASH FLOWS
(in thousands)
(unaudited)
|
|
Three Months Ended September 30, |
|
Nine Months Ended September 30, |
||||
|
|
2025 |
|
2024 |
|
2025 |
|
2024 |
|
|
|
|
|
|
|
|
|
Operating activities: |
|
|
|
|
|
|
|
|
Net income (loss) |
|
$ 3,998 |
|
$ (13,985) |
|
$ 689 |
|
$ 177 |
Adjustments to reconcile net income (loss) to net cash provided by operating activities: |
|
|
|
|
|
|
|
|
Depreciation and amortization |
|
3,271 |
|
3,911 |
|
10,071 |
|
9,977 |
Non-cash operating lease costs |
|
2,741 |
|
3,592 |
|
9,845 |
|
10,927 |
Stock-based compensation |
|
69,608 |
|
66,000 |
|
200,178 |
|
195,600 |
Deferred income taxes |
|
(3,795) |
|
1,743 |
|
(5,030) |
|
167 |
Amortization of intangible assets and acquired technology |
|
25,679 |
|
30,792 |
|
76,549 |
|
96,310 |
Amortization of debt issuance costs |
|
998 |
|
933 |
|
2,930 |
|
2,723 |
Amortization of investment discount, net of premium |
|
(798) |
|
(1,222) |
|
(2,112) |
|
(4,070) |
Debt refinancing costs |
|
— |
|
— |
|
— |
|
1,366 |
Changes in operating assets and liabilities: |
|
|
|
|
|
|
|
|
Accounts receivable |
|
4,971 |
|
42,149 |
|
190,746 |
|
218,567 |
Prepaid expenses and other assets |
|
18,508 |
|
276 |
|
31,376 |
|
8,473 |
Accounts payable and accrued liabilities |
|
(1,134) |
|
(3,461) |
|
(65,153) |
|
(95,483) |
Income taxes payable |
|
42,055 |
|
16,903 |
|
(8,854) |
|
(57,909) |
Deferred revenue |
|
(17,395) |
|
(41,133) |
|
(113,778) |
|
(123,833) |
Net cash provided by operating activities |
|
148,707 |
|
106,498 |
|
327,457 |
|
262,992 |
Investing activities: |
|
|
|
|
|
|
|
|
Purchases of property and equipment |
|
(1,783) |
|
(772) |
|
(6,491) |
|
(2,337) |
Purchases of investments |
|
(26,813) |
|
(124,378) |
|
(261,198) |
|
(393,933) |
Maturities of investments |
|
183,900 |
|
148,400 |
|
460,400 |
|
350,432 |
Sales of investments |
|
— |
|
— |
|
7,929 |
|
— |
Other |
|
— |
|
— |
|
— |
|
1,878 |
Net cash provided by / (used in) investing activities |
|
155,304 |
|
23,250 |
|
200,640 |
|
(43,960) |
Financing activities: |
|
|
|
|
|
|
|
|
Payment of debt |
|
(4,687) |
|
(4,688) |
|
(14,063) |
|
(16,035) |
Payment of debt refinancing costs |
|
— |
|
— |
|
— |
|
(1,349) |
Proceeds from issuance of debt |
|
— |
|
— |
|
— |
|
1,971 |
Proceeds from issuance of common stock under employee stock purchase plan |
|
8,613 |
|
11,470 |
|
23,192 |
|
25,267 |
Payments for dividends related to Class B-2 shares |
|
— |
|
— |
|
(10) |
|
(12) |
Payments for repurchases of common stock |
|
— |
|
— |
|
(101,346) |
|
— |
Payments for taxes related to net share settlement of equity awards |
|
(25,929) |
|
(22,128) |
|
(74,534) |
|
(98,819) |
Proceeds from issuance of shares under equity plans |
|
24,602 |
|
5,385 |
|
48,567 |
|
63,106 |
Net cash provided by / (used in) financing activities |
|
2,599 |
|
(9,961) |
|
(118,194) |
|
(25,871) |
Effect of foreign exchange rate changes on cash and cash equivalents |
|
(9,411) |
|
14,321 |
|
27,111 |
|
6,969 |
Net increase in cash and cash equivalents |
|
297,199 |
|
134,108 |
|
437,014 |
|
200,130 |
Cash and cash equivalents at beginning of period |
|
1,052,275 |
|
798,465 |
|
912,460 |
|
732,443 |
Cash and cash equivalents at end of period |
|
$ 1,349,474 |
|
$ 932,573 |
|
$ 1,349,474 |
|
$ 932,573 |
Supplemental disclosures: |
|
|
|
|
|
|
|
|
Cash paid for interest |
|
$ 30,515 |
|
$ 36,188 |
|
$ 90,742 |
|
$ 111,892 |
Cash paid for income taxes, net of refunds |
|
$ 6,828 |
|
$ 10,745 |
|
$ 28,697 |
|
$ 42,588 |
NON-GAAP FINANCIAL MEASURES AND KEY BUSINESS METRICS
(in thousands, except per share data and percentages)
(unaudited)
RECONCILIATIONS OF GAAP TO NON-GAAP
Reconciliation of GAAP net income (loss) to Non-GAAP net income
|
Three Months Ended |
|
Nine Months Ended |
||||
|
2025 |
|
2024 |
|
2025 |
|
2024 |
|
|
|
|
|
|
|
|
|
(in thousands) |
|
(in thousands) |
||||
GAAP net income (loss) |
$ 3,998 |
|
$ (13,985) |
|
$ 689 |
|
$ 177 |
Stock-based compensation-related charges |
72,812 |
|
67,401 |
|
206,314 |
|
200,078 |
Amortization of intangibles |
25,679 |
|
30,792 |
|
76,549 |
|
96,310 |
Restructuring |
— |
|
1,554 |
|
— |
|
6,808 |
Debt refinancing costs |
— |
|
— |
|
— |
|
1,366 |
Facility impairment |
— |
|
— |
|
624 |
|
— |
Acquisition-related costs |
2,092 |
|
364 |
|
14,120 |
|
7,569 |
Sponsor-related costs |
— |
|
— |
|
176 |
|
773 |
Income tax effect |
10,639 |
|
2,822 |
|
(57,200) |
|
(83,677) |
Non-GAAP net income |
$ 115,220 |
|
$ 88,948 |
|
$ 241,272 |
|
$ 229,404 |
|
|
|
|
|
|
|
|
Net income (loss) per share: |
|
|
|
|
|
|
|
Net income (loss) per share—basic |
$ 0.01 |
|
$ (0.05) |
|
$ 0.00 |
|
$ 0.00 |
Net income (loss) per share—diluted |
$ 0.01 |
|
$ (0.05) |
|
$ 0.00 |
|
$ 0.00 |
Non-GAAP net income per share—basic |
$ 0.38 |
|
$ 0.29 |
|
$ 0.79 |
|
$ 0.76 |
Non-GAAP net income per share—diluted |
$ 0.37 |
|
$ 0.28 |
|
$ 0.78 |
|
$ 0.73 |
|
|
|
|
|
|
|
|
Share count (in thousands): |
|
|
|
|
|
|
|
Weighted-average shares used in computing net income (loss) per share—basic |
306,268 |
|
303,954 |
|
303,976 |
|
300,606 |
Weighted-average shares used in computing net income (loss) per share—diluted |
314,515 |
|
303,954 |
|
310,528 |
|
313,363 |
Weighted-average shares used in computing Non-GAAP net income per share—basic |
306,268 |
|
303,954 |
|
303,976 |
|
300,606 |
Weighted-average shares used in computing Non-GAAP net income per share—diluted |
314,515 |
|
312,619 |
|
310,528 |
|
313,363 |
Reconciliation of GAAP income from operations to Non-GAAP income from operations
|
Three Months Ended |
|
Nine Months Ended |
||||
|
2025 |
|
2024 |
|
2025 |
|
2024 |
|
|
|
|
|
|
|
|
|
(in thousands) |
|
(in thousands) |
||||
GAAP income from operations |
$ 60,866 |
|
$ 50,933 |
|
$ 94,604 |
|
$ 63,622 |
Stock-based compensation-related charges |
72,812 |
|
67,401 |
|
206,314 |
|
200,078 |
Amortization of intangibles |
25,679 |
|
30,792 |
|
76,549 |
|
96,310 |
Restructuring |
— |
|
1,554 |
|
— |
|
6,808 |
Facility Impairment |
— |
|
— |
|
624 |
|
— |
Acquisition-related costs |
2,092 |
|
364 |
|
14,120 |
|
7,569 |
Sponsor-related costs |
— |
|
— |
|
176 |
|
773 |
Non-GAAP income from operations |
$ 161,449 |
|
$ 151,044 |
|
$ 392,387 |
|
$ 375,160 |
|
|
|
|
|
|
|
|
GAAP operating margin (% of total revenue) |
13.9 % |
|
12.1 % |
|
7.6 % |
|
5.3 % |
Non-GAAP operating margin (% of total revenue) |
36.8 % |
|
35.8 % |
|
31.4 % |
|
31.0 % |
NON-GAAP FINANCIAL MEASURES AND KEY BUSINESS METRICS
Adjusted EBITDA Reconciliation
|
Three Months Ended |
|
Nine Months Ended |
|
Trailing Twelve Months ("TTM") Ended September 30, |
||||
|
2025 |
|
2024 |
|
2025 |
|
2024 |
|
2025 |
|
|
|
|
|
|
|
|
|
|
|
(in thousands) |
|
(in thousands) |
|
(in thousands) |
||||
GAAP net income (loss) |
$ 3,998 |
|
$ (13,985) |
|
$ 689 |
|
$ 177 |
|
$ 10,443 |
Income tax expense (benefit) |
45,055 |
|
29,391 |
|
14,868 |
|
(15,154) |
|
73,256 |
Interest income |
(13,751) |
|
(14,829) |
|
(40,011) |
|
(42,001) |
|
(54,447) |
Interest expense |
29,749 |
|
36,345 |
|
88,758 |
|
113,775 |
|
121,047 |
Debt refinancing costs |
— |
|
— |
|
— |
|
1,366 |
|
— |
Other expense (income), net |
(4,185) |
|
14,011 |
|
30,300 |
|
5,459 |
|
7,731 |
Stock-based compensation-related charges |
72,812 |
|
67,401 |
|
206,314 |
|
200,078 |
|
269,324 |
Amortization of intangibles |
25,679 |
|
30,792 |
|
76,549 |
|
96,310 |
|
105,984 |
Facility impairment |
— |
|
— |
|
624 |
|
— |
|
624 |
Restructuring |
— |
|
1,554 |
|
— |
|
6,808 |
|
5,697 |
Acquisition-related costs |
2,092 |
|
364 |
|
14,120 |
|
7,569 |
|
14,120 |
Sponsor-related costs |
— |
|
— |
|
176 |
|
773 |
|
906 |
Depreciation |
3,383 |
|
3,745 |
|
9,988 |
|
9,816 |
|
13,560 |
Adjusted EBITDA |
$ 164,832 |
|
$ 154,789 |
|
$ 402,375 |
|
$ 384,976 |
|
$ 568,245 |
Adjusted Unlevered Free Cash Flow
|
Three Months Ended September 30, |
|
Nine Months Ended September 30, |
||||
|
2025 |
|
2024 |
|
2025 |
|
2024 |
|
|
|
|
|
|
|
|
|
(in thousands, except percentages) |
|
(in thousands, except percentages) |
||||
Total GAAP Revenue |
$ 439,161 |
|
$ 422,481 |
|
$ 1,250,402 |
|
$ 1,211,713 |
Net cash provided by operating activities |
$ 148,707 |
|
$ 106,498 |
|
$ 327,457 |
|
$ 262,992 |
Less: Purchases of property and equipment |
(1,783) |
|
(772) |
|
(6,491) |
|
(2,337) |
Add: Restructuring costs |
228 |
|
1,686 |
|
5,471 |
|
18,159 |
Add: Acquisition-related costs |
3,156 |
|
297 |
|
7,934 |
|
6,979 |
Add: Sponsor-related costs |
— |
|
70 |
|
390 |
|
499 |
Adjusted Free Cash Flow (after-tax)(1)(2) |
$ 150,308 |
|
$ 107,779 |
|
$ 334,761 |
|
$ 286,292 |
Add: Cash paid for interest |
30,515 |
|
36,188 |
|
90,742 |
|
111,892 |
Adjusted Unlevered Free Cash Flow (after-tax)(1)(2) |
$ 180,823 |
|
$ 143,967 |
|
$ 425,503 |
|
$ 398,184 |
|
|
|
|
|
|
|
|
Adjusted Free Cash Flow (after-tax) margin(1)(2) |
34 % |
|
26 % |
|
27 % |
|
24 % |
Adjusted Unlevered Free Cash Flow (after-tax) margin(1)(2) |
41 % |
|
34 % |
|
34 % |
|
33 % |
(1) Includes cash tax payments of $6.8 million and $10.8 million for the three months ended September 30, 2025 and 2024, respectively and $28.6 million and $42.6 million for the nine months ended September 30, 2025 and 2024, respectively.
(2) Includes foreign exchange remeasurement gain (loss) of $3.6 million and $(11.1) million for the three months ended September 30, 2025 and 2024, respectively and $(22.8) million and $(5.2) million for the nine months ended September 30, 2025 and 2024, respectively, primarily from U.S. dollar cash held offshore.
Key Business Metrics
|
September 30, |
||
|
2025 |
|
2024 |
|
|
|
|
|
(in thousands, except percentages) |
||
Cloud Subscription Annual Recurring Revenue |
$ 968,623 |
|
$ 747,811 |
Self-managed Subscription Annual Recurring Revenue |
374,492 |
|
471,030 |
Maintenance Annual Recurring Revenue on Perpetual Licenses |
404,708 |
|
462,935 |
Total Annual Recurring Revenue |
$ 1,747,823 |
|
$ 1,681,776 |
|
|
|
|
Cloud Subscription Net Retention Rate (Global Parent level) |
120 % |
|
126 % |
SUPPLEMENTAL INFORMATION
Additional Business Metrics
|
September 30, |
||
|
2025 |
|
2024 |
Maintenance Renewal Rate |
93 % |
|
94 % |
Total Cloud Subscription Annual Recurring Revenue customers |
2,545 |
|
2,395 |
Cloud transactions processed per month in trillions(1) |
143.3 |
|
101.3 |
(1) Total number of cloud transactions processed on our platform per month in trillions, which measures data processed.
Disaggregation of Revenues
|
Three Months Ended |
|
Nine Months Ended |
||||
|
2025 |
|
2024 |
|
2025 |
|
2024 |
|
(in thousands) |
|
(in thousands) |
||||
Revenues: |
|
|
|
|
|
|
|
Cloud subscription(i) |
$ 230,397 |
|
$ 175,809 |
|
$ 640,263 |
|
$ 488,669 |
Self-managed subscription support and other(i) |
38,839 |
|
46,627 |
|
121,299 |
|
144,126 |
Maintenance(ii) |
100,275 |
|
115,309 |
|
306,403 |
|
349,469 |
Total revenue recognized over time |
369,511 |
|
337,745 |
|
1,067,965 |
|
982,264 |
Self-managed subscription license recognized at a point in time(i)(iii) |
51,425 |
|
65,498 |
|
130,143 |
|
171,443 |
Total subscription and maintenance revenue |
420,936 |
|
403,243 |
|
1,198,108 |
|
1,153,707 |
Professional services(ii) |
18,225 |
|
19,238 |
|
52,294 |
|
58,006 |
Total revenues |
$ 439,161 |
|
$ 422,481 |
|
$ 1,250,402 |
|
$ 1,211,713 |
(i) Included in Subscription revenue on the consolidated statements of operations.
(ii) Included in Maintenance and Professional services revenue on the consolidated statements of operations.
(iii) The Company previously presented Perpetual license revenue separately. Because revenue for perpetual licenses are not material for current or past periods due to our transition to a cloud-only, consumption-driven strategy, the Company has combined these amounts into Self-managed subscription license recognized at a point in time and retrospectively adjusted past periods for comparative purposes.
Revenue recognized over time refers to ratable recognition over the contractual term. Revenue recognized at a point in time refers to recognition upon the later of when the software license is made available or the contractual term commences. Professional services are recognized as services are provided.
Net Debt Reconciliation
|
September 30, |
|
December 31, |
|
2025 |
|
2024 |
|
|
|
|
|
(in millions) |
||
Dollar Term Loan |
$ 1,809 |
|
$ 1,823 |
Less: Cash, cash equivalents, and short-term investments |
(1,472) |
|
(1,232) |
Total net debt |
$ 337 |
|
$ 591 |